Hertz 2010 Annual Report Download - page 92
Download and view the complete annual report
Please find page 92 of the 2010 Hertz annual report below. You can navigate through the pages in the report by either clicking on the pages listed below, or by using the keyword search tool below to find specific information within the annual report.-
 1
1 -
2
-
3
-
4
-
5
-
6
-
7
-
8
-
9
-
10
-
11
-
12
-
13
-
14
-
15
-
16
-
17
-
18
-
19
-
20
-
21
-
22
-
23
-
24
-
25
-
26
-
27
-
28
-
29
-
30
-
31
-
32
-
33
-
34
-
35
-
36
-
37
-
38
-
39
-
40
-
41
-
42
-
43
-
44
-
45
-
46
-
47
-
48
-
49
-
50
-
51
-
52
-
53
-
54
-
55
-
56
-
57
-
58
-
59
-
60
-
61
-
62
-
63
-
64
-
65
-
66
-
67
-
68
-
69
-
70
-
71
-
72
-
73
-
74
-
75
-
76
-
77
-
78
-
79
-
80
-
81
-
 82
82 -
 83
83 -
 84
84 -
 85
85 -
 86
86 -
 87
87 -
 88
88 -
 89
89 -
 90
90 -
 91
91 -
 92
92 -
 93
93 -
 94
94 -
 95
95 -
 96
96 -
 97
97 -
 98
98 -
 99
99 -
 100
100 -
 101
101 -
 102
102 -
103
-
104
-
105
-
106
-
107
-
108
-
109
-
110
-
111
-
112
-
113
-
114
-
115
-
116
-
117
-
118
-
119
-
120
-
121
-
122
-
123
-
124
-
125
-
126
-
127
-
128
-
129
-
130
-
131
-
132
-
133
-
134
-
135
-
136
-
137
-
138
-
139
-
140
-
141
-
142
-
143
-
144
-
145
-
146
-
147
-
148
-
149
-
150
-
151
-
152
-
153
-
154
-
155
-
156
-
157
-
158
-
159
-
160
-
161
-
162
-
163
-
164
-
165
-
166
-
167
-
168
-
169
-
170
-
171
-
172
-
173
-
174
-
175
-
176
-
177
-
178
-
179
-
180
-
181
-
182
-
183
-
184
-
185
-
186
-
187
-
188
-
189
-
190
-
191
-
192
-
193
-
194
-
195
-
196
-
197
-
198
-
199
-
200
 |
 |

ITEM 7. MANAGEMENT’S DISCUSSION AND ANALYSIS OF FINANCIAL CONDITION AND
RESULTS OF OPERATIONS (Continued)
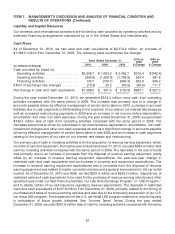
period in 2008. The decrease is primarily due to a reduction in revenue earning equipment expenditures
and the year-over-year change in restricted cash and cash equivalents, partly offset by a decrease in
proceeds from the disposal of revenue earning equipment.
During the year ended December 31, 2010, we generated $262.8 million more cash from financing
activities compared with the same period in 2009. The increase was primarily due to increases in net
proceeds under the revolving lines of credit and proceeds from the issuance of long-term debt (includes
$700 million Senior Notes issued in September 2010 and $500 million Senior Notes issued in December
2010), partly offset by the payment of long-term debt and short-term borrowings and prior year’s
proceeds from the sale of common stock and convertible debt offering. During the year ended
December 31, 2009, we used $566.2 million less cash for financing activities compared with the same
period in 2008. The decrease is primarily due to increases in proceeds from the issuance of long-term
debt, sale of common stock and debt offering, partly offset by increases in payments under revolving
lines of credit, net and payment of long-term debt.
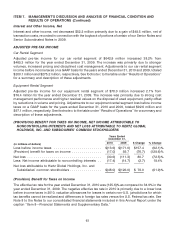
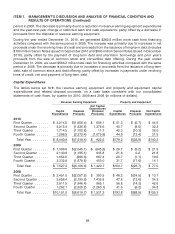
Capital Expenditures
The tables below set forth the revenue earning equipment and property and equipment capital
expenditures and related disposal proceeds, on a cash basis consistent with our consolidated
statements of cash flows, by quarter for 2010, 2009 and 2008 (in millions of dollars).
Revenue Earning Equipment Property and Equipment
Net Capital
Expenditures
Capital Disposal (Disposal Capital Disposal Net Capital
Expenditures Proceeds Proceeds) Expenditures Proceeds Expenditures
2010
First Quarter ........ $ 2,214.5 $(1,606.4) $ 608.1 $ 51.3 $ (6.7) $ 44.6
Second Quarter ..... 3,215.4 (1,836.8) 1,378.6 40.7 (8.5) 32.2
Third Quarter ....... 1,714.5 (1,702.8) 11.7 42.3 (10.3) 32.0
Fourth Quarter ...... 1,296.5 (2,372.4) (1,075.9) 44.9 (13.4) 31.5
Total Year ........ $ 8,440.9 $(7,518.4) $ 922.5 $179.2 $(38.9) $140.3
2009
First Quarter ........ $ 1,399.6 $(2,045.1) $ (645.5) $ 26.7 $ (5.2) $ 21.5
Second Quarter ..... 2,140.9 (1,195.1) 945.8 21.6 0.2 21.8
Third Quarter ....... 1,654.0 (986.6) 667.4 20.7 (1.1) 19.6
Fourth Quarter ...... 2,332.8 (1,879.8) 453.0 31.7 (17.6) 14.1
Total Year ........ $ 7,527.3 $(6,106.6) $ 1,420.7 $100.7 $(23.7) $ 77.0
2008
First Quarter ........ $ 2,451.0 $(2,057.5) $ 393.5 $ 48.2 $(34.5) $ 13.7
Second Quarter ..... 3,626.4 (2,190.6) 1,435.8 47.8 (13.6) 34.2
Third Quarter ....... 2,811.5 (1,846.4) 965.1 56.8 (14.2) 42.6
Fourth Quarter ...... 1,262.1 (2,525.2) (1,263.1) 41.0 (6.2) 34.8
Total Year ........ $10,151.0 $(8,619.7) $ 1,531.3 $193.8 $(68.5) $125.3
68