Hertz 2010 Annual Report Download - page 72
Download and view the complete annual report
Please find page 72 of the 2010 Hertz annual report below. You can navigate through the pages in the report by either clicking on the pages listed below, or by using the keyword search tool below to find specific information within the annual report.-
 1
1 -
2
-
3
-
4
-
5
-
6
-
7
-
8
-
9
-
10
-
11
-
12
-
13
-
14
-
15
-
16
-
17
-
18
-
19
-
20
-
21
-
22
-
23
-
24
-
25
-
26
-
27
-
28
-
29
-
30
-
31
-
32
-
33
-
34
-
35
-
36
-
37
-
38
-
39
-
40
-
41
-
42
-
43
-
44
-
45
-
46
-
47
-
48
-
49
-
50
-
51
-
52
-
53
-
54
-
55
-
56
-
57
-
58
-
59
-
60
-
61
-
 62
62 -
 63
63 -
 64
64 -
 65
65 -
 66
66 -
 67
67 -
 68
68 -
 69
69 -
 70
70 -
 71
71 -
 72
72 -
 73
73 -
 74
74 -
 75
75 -
 76
76 -
 77
77 -
 78
78 -
 79
79 -
 80
80 -
 81
81 -
 82
82 -
83
-
84
-
85
-
86
-
87
-
88
-
89
-
90
-
91
-
92
-
93
-
94
-
95
-
96
-
97
-
98
-
99
-
100
-
101
-
102
-
103
-
104
-
105
-
106
-
107
-
108
-
109
-
110
-
111
-
112
-
113
-
114
-
115
-
116
-
117
-
118
-
119
-
120
-
121
-
122
-
123
-
124
-
125
-
126
-
127
-
128
-
129
-
130
-
131
-
132
-
133
-
134
-
135
-
136
-
137
-
138
-
139
-
140
-
141
-
142
-
143
-
144
-
145
-
146
-
147
-
148
-
149
-
150
-
151
-
152
-
153
-
154
-
155
-
156
-
157
-
158
-
159
-
160
-
161
-
162
-
163
-
164
-
165
-
166
-
167
-
168
-
169
-
170
-
171
-
172
-
173
-
174
-
175
-
176
-
177
-
178
-
179
-
180
-
181
-
182
-
183
-
184
-
185
-
186
-
187
-
188
-
189
-
190
-
191
-
192
-
193
-
194
-
195
-
196
-
197
-
198
-
199
-
200
 |
 |
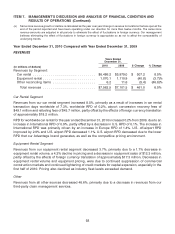
ITEM 7. MANAGEMENT’S DISCUSSION AND ANALYSIS OF FINANCIAL CONDITION AND
RESULTS OF OPERATIONS (Continued)
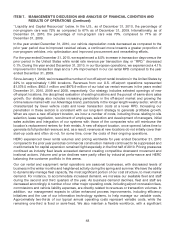
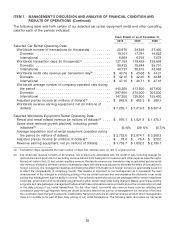
‘‘Liquidity and Capital Resources’’ below. In the U.S., as of December 31, 2010, the percentage of
non-program cars was 72% as compared to 67% as of December 31, 2009. Internationally, as of
December 31, 2010, the percentage of non-program cars was 70%, compared to 71% as of
December 31, 2009.
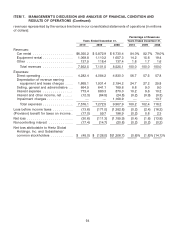
In the year ended December 31, 2010, our vehicle depreciation costs decreased as compared to the
prior year period due to improved residual values, a continued move towards a greater proportion of
non-program vehicles, mix optimization and improved procurement and remarketing efforts.
For the year ended December 31, 2010, we experienced a 8.5% increase in transaction days versus the
prior period in the United States while rental rate revenue per transaction day, or ‘‘RPD,’’ decreased
0.1%. During the year ended December 31, 2010, in our European operations, we experienced a 4.1%
improvement in transaction days and a 1.4% improvement in our car rental RPD compared to the year
ended December 31, 2009.
Since January 1, 2008, we increased the number of our off-airport rental locations in the United States by
22% to approximately 1,930 locations. Revenues from our U.S. off-airport operations represented
$1,079.5 million, $953.1 million and $975.9 million of our total car rental revenues in the years ended
December 31, 2010, 2009 and 2008, respectively. Our strategy includes selected openings of new
off-airport locations, the disciplined evaluation of existing locations and the pursuit of same-store sales
growth. Our strategy also includes increasing penetration in the off-airport market and growing the
online leisure market with our Advantage brand, particularly in the longer length weekly sector, which is
characterized by lower vehicle costs and lower transaction costs at a lower RPD. Increasing our
penetration in these sectors is consistent with our long-term strategy to generate profitable growth.
When we open a new off-airport location, we incur a number of costs, including those relating to site
selection, lease negotiation, recruitment of employees, selection and development of managers, initial
sales activities and integration of our systems with those of the companies who will reimburse the
location’s replacement renters for their rentals. A new off-airport location, once opened, takes time to
generate its full potential revenues and, as a result, revenues at new locations do not initially cover their
start-up costs and often do not, for some time, cover the costs of their ongoing operations.
HERC experienced lower rental volumes and pricing worldwide for year ended December 31, 2010
compared to the prior year period as commercial construction markets continued to be suppressed and
credit markets for capital expansion remained tight especially in the first half of 2010. Pricing pressures
continued as industry fleet levels exceeded demand creating competitive downward movement and
irrational actions. Volume and price declines were partly offset by industrial performance and HERC
balancing the customer portfolio in this arena.
Our car rental and equipment rental operations are seasonal businesses, with decreased levels of
business in the winter months and heightened activity during the spring and summer. We have the ability
to dynamically manage fleet capacity, the most significant portion of our cost structure, to meet market
demand. For instance, to accommodate increased demand, we increase our available fleet and staff
during the second and third quarters of the year. As business demand declines, fleet and staff are
decreased accordingly. A number of our other major operating costs, including airport concession fees,
commissions and vehicle liability expenses, are directly related to revenues or transaction volumes. In
addition, our management expects to utilize enhanced process improvements, including efficiency
initiatives and the use of our information technology systems, to help manage our variable costs.
Approximately two-thirds of our typical annual operating costs represent variable costs, while the
remaining one-third is fixed or semi-fixed. We also maintain a flexible workforce, with a significant
48