Hertz 2010 Annual Report Download - page 83
Download and view the complete annual report
Please find page 83 of the 2010 Hertz annual report below. You can navigate through the pages in the report by either clicking on the pages listed below, or by using the keyword search tool below to find specific information within the annual report.-
 1
1 -
2
-
3
-
4
-
5
-
6
-
7
-
8
-
9
-
10
-
11
-
12
-
13
-
14
-
15
-
16
-
17
-
18
-
19
-
20
-
21
-
22
-
23
-
24
-
25
-
26
-
27
-
28
-
29
-
30
-
31
-
32
-
33
-
34
-
35
-
36
-
37
-
38
-
39
-
40
-
41
-
42
-
43
-
44
-
45
-
46
-
47
-
48
-
49
-
50
-
51
-
52
-
53
-
54
-
55
-
56
-
57
-
58
-
59
-
60
-
61
-
62
-
63
-
64
-
65
-
66
-
67
-
68
-
69
-
70
-
71
-
72
-
 73
73 -
 74
74 -
 75
75 -
 76
76 -
 77
77 -
 78
78 -
 79
79 -
 80
80 -
 81
81 -
 82
82 -
 83
83 -
 84
84 -
 85
85 -
 86
86 -
 87
87 -
 88
88 -
 89
89 -
 90
90 -
 91
91 -
 92
92 -
 93
93 -
94
-
95
-
96
-
97
-
98
-
99
-
100
-
101
-
102
-
103
-
104
-
105
-
106
-
107
-
108
-
109
-
110
-
111
-
112
-
113
-
114
-
115
-
116
-
117
-
118
-
119
-
120
-
121
-
122
-
123
-
124
-
125
-
126
-
127
-
128
-
129
-
130
-
131
-
132
-
133
-
134
-
135
-
136
-
137
-
138
-
139
-
140
-
141
-
142
-
143
-
144
-
145
-
146
-
147
-
148
-
149
-
150
-
151
-
152
-
153
-
154
-
155
-
156
-
157
-
158
-
159
-
160
-
161
-
162
-
163
-
164
-
165
-
166
-
167
-
168
-
169
-
170
-
171
-
172
-
173
-
174
-
175
-
176
-
177
-
178
-
179
-
180
-
181
-
182
-
183
-
184
-
185
-
186
-
187
-
188
-
189
-
190
-
191
-
192
-
193
-
194
-
195
-
196
-
197
-
198
-
199
-
200
 |
 |

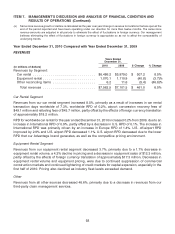
ITEM 7. MANAGEMENT’S DISCUSSION AND ANALYSIS OF FINANCIAL CONDITION AND
RESULTS OF OPERATIONS (Continued)
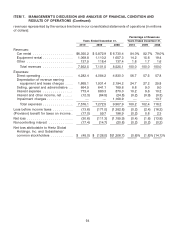
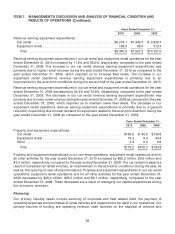
EXPENSES
Years Ended
December 31,
2010 2009 $ Change % Change
(in millions of dollars)
Expenses:
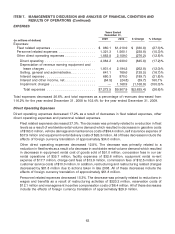
Fleet related expenses ....................... $1,003.2 $ 880.1 $123.1 14.0%
Personnel related expenses ................... 1,411.2 1,321.3 89.9 6.8%
Other direct operating expenses ................ 1,868.0 1,882.8 (14.8) (0.8)%
Direct operating .......................... 4,282.4 4,084.2 198.2 4.9%
Depreciation of revenue earning equipment and
lease charges .......................... 1,868.1 1,931.4 (63.3) (3.3)%
Selling, general and administrative ............ 664.5 641.1 23.4 3.6%
Interest expense .......................... 773.4 680.3 93.1 13.7%
Interest and other income, net ................ (12.3) (64.5) 52.2 (80.9)%
Total expenses ......................... $7,576.1 $7,272.5 $303.6 4.2%
Total expenses increased 4.2%, and total expenses as a percentage of revenues decreased from 102.4%
for the year ended December 31, 2009 to 100.2% for the year ended December 31, 2010.
Direct Operating Expenses
Direct operating expenses increased 4.9% as a result of increases in fleet related expenses and
personnel related expenses, partly offset by a decrease in other direct operating expenses.
Fleet related expenses increased 14.0%. The increase was primarily related to a worldwide rental
volume demand which resulted in increases in gasoline costs of $41.5 million, self insurance
expense of $33.1 million, vehicle license taxes of $16.5 million and vehicle damage costs of
$14.8 million. Equipment maintenance costs and freight costs increased by $13.7 million and
$9.0 million, respectively, relating to efforts to maximize the use of our existing fleet.
Personnel related expenses increased 6.8%. The increase was primarily related to increases in
incentive compensation costs of $30.8 million, wages and benefits of $29.1 million, outside
services, including transporter wages, of $22.5 million and payroll taxes of $4.8 million. These
increases primarily related to improved results in our worldwide car rental operations, as well as
additional U.S. off-airport locations and Advantage locations opened during 2010.
Other direct operating expenses decreased 0.8%. The decrease was primarily related to decreases
in restructuring and restructuring related charges of $51.3 million, equipment rental cost of goods
sold of $10.9 million, field administrative of $9.2 million, field systems of $7.3 million, equipment
rental credit and collections expense of $7.3 million, facility expenses of $6.2 million and customer
service costs of $5.1 million. The decreases in fleet related expenses primarily related to disciplined
cost management and reductions in equipment rental volume. The decreases in other direct
operating expenses were partly offset by increases in commissions of $30.1 million, concession
fees in our car rental operations of $27.4 million, charge card fees of $14.0 million and reservation
costs of $5.1 million primarily related to improved car rental volume demand.
59