Hertz 2010 Annual Report Download - page 151
Download and view the complete annual report
Please find page 151 of the 2010 Hertz annual report below. You can navigate through the pages in the report by either clicking on the pages listed below, or by using the keyword search tool below to find specific information within the annual report.-
 1
1 -
2
-
3
-
4
-
5
-
6
-
7
-
8
-
9
-
10
-
11
-
12
-
13
-
14
-
15
-
16
-
17
-
18
-
19
-
20
-
21
-
22
-
23
-
24
-
25
-
26
-
27
-
28
-
29
-
30
-
31
-
32
-
33
-
34
-
35
-
36
-
37
-
38
-
39
-
40
-
41
-
42
-
43
-
44
-
45
-
46
-
47
-
48
-
49
-
50
-
51
-
52
-
53
-
54
-
55
-
56
-
57
-
58
-
59
-
60
-
61
-
62
-
63
-
64
-
65
-
66
-
67
-
68
-
69
-
70
-
71
-
72
-
73
-
74
-
75
-
76
-
77
-
78
-
79
-
80
-
81
-
82
-
83
-
84
-
85
-
86
-
87
-
88
-
89
-
90
-
91
-
92
-
93
-
94
-
95
-
96
-
97
-
98
-
99
-
100
-
101
-
102
-
103
-
104
-
105
-
106
-
107
-
108
-
109
-
110
-
111
-
112
-
113
-
114
-
115
-
116
-
117
-
118
-
119
-
120
-
121
-
122
-
123
-
124
-
125
-
126
-
127
-
128
-
129
-
130
-
131
-
132
-
133
-
134
-
135
-
136
-
137
-
138
-
139
-
140
-
 141
141 -
 142
142 -
 143
143 -
 144
144 -
 145
145 -
 146
146 -
 147
147 -
 148
148 -
 149
149 -
 150
150 -
 151
151 -
 152
152 -
 153
153 -
 154
154 -
 155
155 -
 156
156 -
 157
157 -
 158
158 -
 159
159 -
 160
160 -
 161
161 -
162
-
163
-
164
-
165
-
166
-
167
-
168
-
169
-
170
-
171
-
172
-
173
-
174
-
175
-
176
-
177
-
178
-
179
-
180
-
181
-
182
-
183
-
184
-
185
-
186
-
187
-
188
-
189
-
190
-
191
-
192
-
193
-
194
-
195
-
196
-
197
-
198
-
199
-
200
 |
 |
HERTZ GLOBAL HOLDINGS, INC. AND SUBSIDIARIES
NOTES TO CONSOLIDATED FINANCIAL STATEMENTS (Continued)
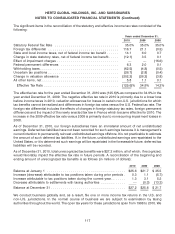
including liability for environmental indemnities, reflected in our consolidated balance sheets in ‘‘Other
accrued liabilities’’ were $1.6 million and $2.0 million, respectively. The accrual generally represents the
estimated cost to study potential environmental issues at sites deemed to require investigation or
clean-up activities, and the estimated cost to implement remediation actions, including on-going
maintenance, as required. Cost estimates are developed by site. Initial cost estimates are based on
historical experience at similar sites and are refined over time on the basis of in-depth studies of the sites.
For many sites, the remediation costs and other damages for which we ultimately may be responsible
cannot be reasonably estimated because of uncertainties with respect to factors such as our connection
to the site, the materials there, the involvement of other potentially responsible parties, the application of
laws and other standards or regulations, site conditions, and the nature and scope of investigations,
studies, and remediation to be undertaken (including the technologies to be required and the extent,
duration, and success of remediation).
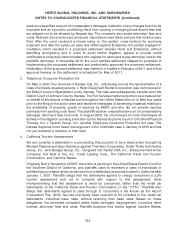
Note 12—Restructuring
As part of our ongoing effort to implement our strategy of reducing operating costs, we have evaluated
our workforce and operations and made adjustments, including headcount reductions and business
process reengineering resulting in optimized work flow at rental locations and maintenance facilities as
well as streamlined our back-office operations and evaluated potential outsourcing opportunities. When
we made adjustments to our workforce and operations, we incurred incremental expenses that delay the
benefit of a more efficient workforce and operating structure, but we believe that increased operating
efficiency and reduced costs associated with the operation of our business are important to our
long-term competitiveness.
During 2007 through 2010, we announced several initiatives to improve our competitiveness and
industry leadership through targeted job reductions. These initiatives included, but were not limited to,
job reductions at our corporate headquarters and back-office operations in the U.S. and Europe. As part
of our re-engineering optimization we outsourced selected functions globally. In addition, we
streamlined operations and reduced costs by initiating the closure of targeted car rental locations and
equipment rental branches throughout the world. The largest of these closures occurred in 2008 which
resulted in closures of approximately 250 off-airport locations and 22 branches in our U.S. equipment
rental business. These initiatives impacted approximately 12,000 employees. From January 1, 2007
through December 31, 2010, we incurred $474.1 million ($239.7 million for our car rental segment,
$181.0 million for our equipment rental segment and $53.4 of other) of restructuring charges.
Additional efficiency and cost saving initiatives are being developed in 2011. However, we presently do
not have firm plans or estimates of any related expenses.
127