Hertz 2010 Annual Report Download - page 184
Download and view the complete annual report
Please find page 184 of the 2010 Hertz annual report below. You can navigate through the pages in the report by either clicking on the pages listed below, or by using the keyword search tool below to find specific information within the annual report.-
 1
1 -
2
-
3
-
4
-
5
-
6
-
7
-
8
-
9
-
10
-
11
-
12
-
13
-
14
-
15
-
16
-
17
-
18
-
19
-
20
-
21
-
22
-
23
-
24
-
25
-
26
-
27
-
28
-
29
-
30
-
31
-
32
-
33
-
34
-
35
-
36
-
37
-
38
-
39
-
40
-
41
-
42
-
43
-
44
-
45
-
46
-
47
-
48
-
49
-
50
-
51
-
52
-
53
-
54
-
55
-
56
-
57
-
58
-
59
-
60
-
61
-
62
-
63
-
64
-
65
-
66
-
67
-
68
-
69
-
70
-
71
-
72
-
73
-
74
-
75
-
76
-
77
-
78
-
79
-
80
-
81
-
82
-
83
-
84
-
85
-
86
-
87
-
88
-
89
-
90
-
91
-
92
-
93
-
94
-
95
-
96
-
97
-
98
-
99
-
100
-
101
-
102
-
103
-
104
-
105
-
106
-
107
-
108
-
109
-
110
-
111
-
112
-
113
-
114
-
115
-
116
-
117
-
118
-
119
-
120
-
121
-
122
-
123
-
124
-
125
-
126
-
127
-
128
-
129
-
130
-
131
-
132
-
133
-
134
-
135
-
136
-
137
-
138
-
139
-
140
-
141
-
142
-
143
-
144
-
145
-
146
-
147
-
148
-
149
-
150
-
151
-
152
-
153
-
154
-
155
-
156
-
157
-
158
-
159
-
160
-
161
-
162
-
163
-
164
-
165
-
166
-
167
-
168
-
169
-
170
-
171
-
172
-
173
-
 174
174 -
 175
175 -
 176
176 -
 177
177 -
 178
178 -
 179
179 -
 180
180 -
 181
181 -
 182
182 -
 183
183 -
 184
184 -
 185
185 -
 186
186 -
 187
187 -
 188
188 -
 189
189 -
 190
190 -
 191
191 -
 192
192 -
 193
193 -
 194
194 -
195
-
196
-
197
-
198
-
199
-
200
 |
 |

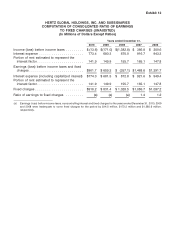
Exhibit 12
HERTZ GLOBAL HOLDINGS, INC. AND SUBSIDIARIES
COMPUTATION OF CONSOLIDATED RATIO OF EARNINGS
TO FIXED CHARGES (UNAUDITED)
(In Millions of Dollars Except Ratios)
Years ended December 31,
2010 2009 2008 2007 2006
Income (loss) before income taxes ......... $(13.6) $(171.0) $(1,382.8) $ 386.8 $ 200.6
Interest expense ...................... 773.4 680.3 870.0 916.7 943.3
Portion of rent estimated to represent the
interest factor ....................... 141.9 149.9 155.7 165.1 147.8
Earnings (loss) before income taxes and fixed
charges ........................... $901.7 $ 659.2 $ (357.1) $1,468.6 $1,291.7
Interest expense (including capitalized interest) $774.3 $ 681.5 $ 872.8 $ 921.6 $ 949.4
Portion of rent estimated to represent the
interest factor ....................... 141.9 149.9 155.7 165.1 147.8
Fixed charges ........................ $916.2 $ 831.4 $ 1,028.5 $1,086.7 $1,097.2
Ratio of earnings to fixed charges ......... (a) (a) (a) 1.4 1.2
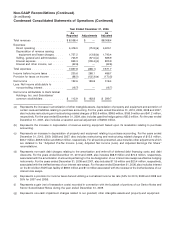
(a) Earnings (loss) before income taxes, noncontrolling interest and fixed charges for the years ended December 31, 2010, 2009
and 2008 were inadequate to cover fixed charges for the period by $14.5 million, $172.2 million and $1,385.6 million,
respectively.