Hertz 2010 Annual Report Download - page 105
Download and view the complete annual report
Please find page 105 of the 2010 Hertz annual report below. You can navigate through the pages in the report by either clicking on the pages listed below, or by using the keyword search tool below to find specific information within the annual report.-
 1
1 -
2
-
3
-
4
-
5
-
6
-
7
-
8
-
9
-
10
-
11
-
12
-
13
-
14
-
15
-
16
-
17
-
18
-
19
-
20
-
21
-
22
-
23
-
24
-
25
-
26
-
27
-
28
-
29
-
30
-
31
-
32
-
33
-
34
-
35
-
36
-
37
-
38
-
39
-
40
-
41
-
42
-
43
-
44
-
45
-
46
-
47
-
48
-
49
-
50
-
51
-
52
-
53
-
54
-
55
-
56
-
57
-
58
-
59
-
60
-
61
-
62
-
63
-
64
-
65
-
66
-
67
-
68
-
69
-
70
-
71
-
72
-
73
-
74
-
75
-
76
-
77
-
78
-
79
-
80
-
81
-
82
-
83
-
84
-
85
-
86
-
87
-
88
-
89
-
90
-
91
-
92
-
93
-
94
-
 95
95 -
 96
96 -
 97
97 -
 98
98 -
 99
99 -
 100
100 -
 101
101 -
 102
102 -
 103
103 -
 104
104 -
 105
105 -
 106
106 -
 107
107 -
 108
108 -
 109
109 -
 110
110 -
 111
111 -
 112
112 -
 113
113 -
 114
114 -
 115
115 -
116
-
117
-
118
-
119
-
120
-
121
-
122
-
123
-
124
-
125
-
126
-
127
-
128
-
129
-
130
-
131
-
132
-
133
-
134
-
135
-
136
-
137
-
138
-
139
-
140
-
141
-
142
-
143
-
144
-
145
-
146
-
147
-
148
-
149
-
150
-
151
-
152
-
153
-
154
-
155
-
156
-
157
-
158
-
159
-
160
-
161
-
162
-
163
-
164
-
165
-
166
-
167
-
168
-
169
-
170
-
171
-
172
-
173
-
174
-
175
-
176
-
177
-
178
-
179
-
180
-
181
-
182
-
183
-
184
-
185
-
186
-
187
-
188
-
189
-
190
-
191
-
192
-
193
-
194
-
195
-
196
-
197
-
198
-
199
-
200
 |
 |

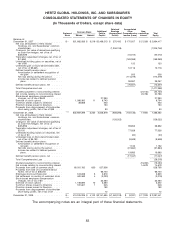
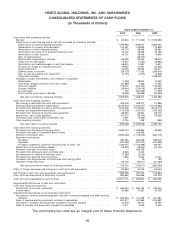
HERTZ GLOBAL HOLDINGS, INC. AND SUBSIDIARIES
CONSOLIDATED BALANCE SHEETS
(In Thousands of Dollars)
December 31,
2010 2009
ASSETS
Cash and cash equivalents ................................ $ 2,374,170 $ 985,642
Restricted cash and cash equivalents ........................ 207,576 365,159
Receivables, less allowance for doubtful accounts of $19,708 and
$21,268 ............................................ 1,356,553 1,325,332
Inventories, at lower of cost or market ........................ 87,429 93,415
Prepaid expenses and other assets .......................... 352,782 300,125
Revenue earning equipment, at cost:
Cars .............................................. 8,435,077 8,205,579
Less accumulated depreciation .......................... (1,199,355) (1,186,299)
Other equipment ...................................... 2,756,101 2,582,029
Less accumulated depreciation .......................... (1,052,414) (749,724)
Total revenue earning equipment ....................... 8,939,409 8,851,585
Property and equipment, at cost:
Land, buildings and leasehold improvements ................. 1,071,987 1,023,891
Service equipment and other ............................. 900,271 838,906
1,972,258 1,862,797
Less accumulated depreciation .......................... (808,689) (674,668)
Total property and equipment ......................... 1,163,569 1,188,129
Other intangible assets, net ............................... 2,550,559 2,597,682
Goodwill ............................................. 300,174 295,350
Total assets ...................................... $17,332,221 $16,002,419
LIABILITIES AND EQUITY
Accounts payable ...................................... $ 944,973 $ 658,671
Accrued salaries and other compensation ..................... 439,217 465,281
Other accrued liabilities .................................. 630,865 559,541
Accrued taxes ......................................... 108,940 108,356
Debt ................................................ 11,306,429 10,364,367
Public liability and property damage ......................... 278,685 277,828
Deferred taxes on income ................................. 1,491,789 1,470,934
Total liabilities ..................................... 15,200,898 13,904,978
Commitments and contingencies
Equity:
Hertz Global Holdings Inc. and Subsidiaries stockholders’ equity
Preferred Stock, $0.01 par value, 200,000,000 shares authorized, no
shares issued and outstanding .......................... — —
Common Stock, $0.01 par value, 2,000,000,000 shares authorized,
413,462,889 and 410,245,225 shares issued and outstanding .... 4,135 4,102
Additional paid-in capital ................................ 3,183,225 3,141,695
Accumulated deficit .................................... (1,110,362) (1,062,318)
Accumulated other comprehensive income (loss) .............. 37,823 (3,331)
Total Hertz Global Holdings, Inc. and Subsidiaries stockholders’
equity ......................................... 2,114,821 2,080,148
Noncontrolling interest ................................... 16,502 17,293
Total equity ...................................... 2,131,323 2,097,441
Total liabilities and equity ............................ $17,332,221 $16,002,419
The accompanying notes are an integral part of these financial statements.
81