Hertz 2010 Annual Report Download - page 70
Download and view the complete annual report
Please find page 70 of the 2010 Hertz annual report below. You can navigate through the pages in the report by either clicking on the pages listed below, or by using the keyword search tool below to find specific information within the annual report.-
 1
1 -
2
-
3
-
4
-
5
-
6
-
7
-
8
-
9
-
10
-
11
-
12
-
13
-
14
-
15
-
16
-
17
-
18
-
19
-
20
-
21
-
22
-
23
-
24
-
25
-
26
-
27
-
28
-
29
-
30
-
31
-
32
-
33
-
34
-
35
-
36
-
37
-
38
-
39
-
40
-
41
-
42
-
43
-
44
-
45
-
46
-
47
-
48
-
49
-
50
-
51
-
52
-
53
-
54
-
55
-
56
-
57
-
58
-
59
-
 60
60 -
 61
61 -
 62
62 -
 63
63 -
 64
64 -
 65
65 -
 66
66 -
 67
67 -
 68
68 -
 69
69 -
 70
70 -
 71
71 -
 72
72 -
 73
73 -
 74
74 -
 75
75 -
 76
76 -
 77
77 -
 78
78 -
 79
79 -
 80
80 -
81
-
82
-
83
-
84
-
85
-
86
-
87
-
88
-
89
-
90
-
91
-
92
-
93
-
94
-
95
-
96
-
97
-
98
-
99
-
100
-
101
-
102
-
103
-
104
-
105
-
106
-
107
-
108
-
109
-
110
-
111
-
112
-
113
-
114
-
115
-
116
-
117
-
118
-
119
-
120
-
121
-
122
-
123
-
124
-
125
-
126
-
127
-
128
-
129
-
130
-
131
-
132
-
133
-
134
-
135
-
136
-
137
-
138
-
139
-
140
-
141
-
142
-
143
-
144
-
145
-
146
-
147
-
148
-
149
-
150
-
151
-
152
-
153
-
154
-
155
-
156
-
157
-
158
-
159
-
160
-
161
-
162
-
163
-
164
-
165
-
166
-
167
-
168
-
169
-
170
-
171
-
172
-
173
-
174
-
175
-
176
-
177
-
178
-
179
-
180
-
181
-
182
-
183
-
184
-
185
-
186
-
187
-
188
-
189
-
190
-
191
-
192
-
193
-
194
-
195
-
196
-
197
-
198
-
199
-
200
 |
 |

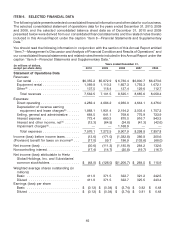
ITEM 6. SELECTED FINANCIAL DATA (Continued)
December 31,
2010 2009 2008 2007 2006
Balance Sheet Data
Cash and cash equivalents ........ $ 2,374.2 $ 985.6 $ 594.3 $ 730.2 $ 674.5
Total assets(f) ................... 17,332.2 16,002.4 16,451.4 19,255.7 18,677.4
Total debt ..................... 11,306.4 10,364.4 10,972.3 11,960.1 12,276.2
Total equity .................... 2,131.3 2,097.4 1,488.3 2,934.4 2,549.4
(a) Includes fees and certain cost reimbursements from our licensees and revenues from our car leasing operations and third-
party claim management services.
(b) For the years ended December 31, 2010, 2009, 2008, 2007 and 2006, depreciation of revenue earning equipment increased
by $22.7 million, $19.3 million, $32.7 million and $0.6 million and reduced by $13.1 million, respectively, resulting from the net
effects of changing depreciation rates to reflect changes in the estimated residual value of revenue earning equipment. For
the years ended December 31, 2010, 2009, 2008, 2007 and 2006, depreciation of revenue earning equipment and lease
charges includes net losses of $42.9 million, $72.0 million, $74.3 million and $13.3 million and a net gain of $40.1 million,
respectively, from the disposal of revenue earning equipment.
(c) For the year ended December 31, 2009, reflects interest income of $16.0 million and a gain of $48.5 million, net of transaction
costs, recorded in connection with the buyback of portions of certain of our Senior Notes and Senior Subordinated Notes.
This amount for all other years reflected above primarily consists of interest income.
(d) For the year ended December 31, 2008, we recorded non-cash impairment charges related to our goodwill, other intangible
assets and property and equipment.
(e) For the year ended December 31, 2010, 2009 and 2008, tax valuation allowances increased by $27.5 million, $39.7 million
and $58.5 million, respectively, (excluding the effects of foreign currency translation) relating to the realization of deferred tax
assets attributable to net operating losses, credits and other temporary differences in various jurisdictions. Additionally,
certain tax reserves were recorded and certain tax reserves were released due to settlement for various uncertain tax
positions in Federal, state and foreign jurisdictions. For the year ended December 31, 2007, we reversed a valuation
allowance of $9.1 million relating to the realization of deferred tax assets attributable to net operating losses and other
temporary differences in certain European countries. Additionally, certain tax reserves were recorded for various uncertain
tax positions in Federal, state and foreign jurisdictions. For the year ended December 31, 2006, we established valuation
allowances of $9.8 million relating to the realization of deferred tax assets attributable to net operating losses and other
temporary differences in certain European countries. Additionally, certain tax reserves were recorded for certain federal and
state uncertain tax positions.
(f) Substantially all of our revenue earning equipment, as well as certain related assets, are owned by special purpose entities,
or are subject to liens in favor of our lenders under our various credit facilities, other secured financings and asset-backed
securities programs. None of such assets are available to satisfy the claims of our general creditors. For a description of
those facilities, see ‘‘Item 7—Management’s Discussion and Analysis of Financial Condition and Results of Operations—
Liquidity and Capital Resources’’ in this Annual Report.
46