Hertz 2010 Annual Report Download - page 91
Download and view the complete annual report
Please find page 91 of the 2010 Hertz annual report below. You can navigate through the pages in the report by either clicking on the pages listed below, or by using the keyword search tool below to find specific information within the annual report.-
 1
1 -
2
-
3
-
4
-
5
-
6
-
7
-
8
-
9
-
10
-
11
-
12
-
13
-
14
-
15
-
16
-
17
-
18
-
19
-
20
-
21
-
22
-
23
-
24
-
25
-
26
-
27
-
28
-
29
-
30
-
31
-
32
-
33
-
34
-
35
-
36
-
37
-
38
-
39
-
40
-
41
-
42
-
43
-
44
-
45
-
46
-
47
-
48
-
49
-
50
-
51
-
52
-
53
-
54
-
55
-
56
-
57
-
58
-
59
-
60
-
61
-
62
-
63
-
64
-
65
-
66
-
67
-
68
-
69
-
70
-
71
-
72
-
73
-
74
-
75
-
76
-
77
-
78
-
79
-
80
-
 81
81 -
 82
82 -
 83
83 -
 84
84 -
 85
85 -
 86
86 -
 87
87 -
 88
88 -
 89
89 -
 90
90 -
 91
91 -
 92
92 -
 93
93 -
 94
94 -
 95
95 -
 96
96 -
 97
97 -
 98
98 -
 99
99 -
 100
100 -
 101
101 -
102
-
103
-
104
-
105
-
106
-
107
-
108
-
109
-
110
-
111
-
112
-
113
-
114
-
115
-
116
-
117
-
118
-
119
-
120
-
121
-
122
-
123
-
124
-
125
-
126
-
127
-
128
-
129
-
130
-
131
-
132
-
133
-
134
-
135
-
136
-
137
-
138
-
139
-
140
-
141
-
142
-
143
-
144
-
145
-
146
-
147
-
148
-
149
-
150
-
151
-
152
-
153
-
154
-
155
-
156
-
157
-
158
-
159
-
160
-
161
-
162
-
163
-
164
-
165
-
166
-
167
-
168
-
169
-
170
-
171
-
172
-
173
-
174
-
175
-
176
-
177
-
178
-
179
-
180
-
181
-
182
-
183
-
184
-
185
-
186
-
187
-
188
-
189
-
190
-
191
-
192
-
193
-
194
-
195
-
196
-
197
-
198
-
199
-
200
 |
 |

ITEM 7. MANAGEMENT’S DISCUSSION AND ANALYSIS OF FINANCIAL CONDITION AND
RESULTS OF OPERATIONS (Continued)
Liquidity and Capital Resources
Our domestic and international operations are funded by cash provided by operating activities and by
extensive financing arrangements maintained by us in the United States and internationally.
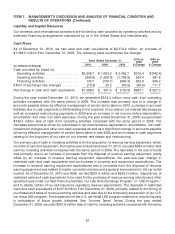
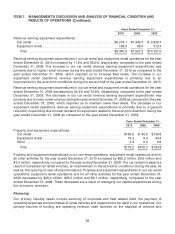
Cash Flows
As of December 31, 2010, we had cash and cash equivalents of $2,374.2 million, an increase of
$1,388.5 million from December 31, 2009. The following table summarizes the change:
2010 vs. 2009 vs.
Years Ended December 31, 2009 2008
2010 2009 2008 $ Change $ Change
(in millions of dollars)
Cash provided by (used in):
Operating activities ................ $2,208.7 $ 1,693.3 $ 2,435.7 $515.4 $(742.4)
Investing activities ................. (943.6) (1,208.0) (1,799.8) 264.4 591.8
Financing activities ................ 133.7 (129.1) (695.3) 262.8 566.2
Effect of exchange rate changes ........ (10.3) 35.2 (76.5) (45.5) 111.7
Net change in cash and cash equivalents . $1,388.5 $ 391.4 $ (135.9) $997.1 $ 527.3
During the year ended December 31, 2010, we generated $515.4 million more cash from operating
activities compared with the same period in 2009. The increase was primarily due to a change in
accounts payable driven by effective management of vendor terms taken in 2010, a change in accrued
liabilities due to cash payments in 2009 relating to the buydown of our rate on our interest rate swaps as
well as increased restructuring payments in 2009 and an increase in net income before depreciation,
amortization and other non-cash expenses. During the year ended December 31, 2009, we generated
$742.4 million less of cash from operating activities compared with the same period in 2008. The
decrease was primarily driven by a decrease in net income before depreciation, amortization, non-cash
impairment charges and other non-cash expenses as well as a significant change in accounts payable
driven by effective management of vendor terms taken in late 2008 and an increase in cash payments
relating to the buydown of our rate on our interest rate swaps and restructuring.
Our primary use of cash in investing activities is for the acquisition of revenue earning equipment, which
consists of cars and equipment. During the year ended December 31, 2010, we used $264.4 million less
cash for investing activities compared with the same period in 2009. The decrease in the use of funds
was primarily due to an increase in proceeds from the disposal of revenue earning equipment, partly
offset by an increase in revenue earning equipment expenditures, the year-over-year change in
restricted cash and cash equivalents and an increase in property and equipment expenditures. The
increase in revenue earning equipment expenditures and in proceeds from the disposal of revenue
earning equipment was related to higher car rental volumes and a general improvement in the car rental
market. As of December 31, 2010 and 2009, we had $207.6 million and $365.2 million, respectively, of
restricted cash and cash equivalents to be used for the purchase of revenue earning vehicles and other
specified uses under our fleet financing facilities, our Like Kind Exchange Program, or ‘‘LKE Program,’’
and to satisfy certain of our self-insurance regulatory reserve requirements. The decrease in restricted
cash and cash equivalents of $157.6 million from December 31, 2009, primarily related to the timing of
purchases and sales of revenue earning vehicles and also due to the temporary suspension of our U.S.
car rental LKE program. The suspension of the U.S. car rental LKE program enabled us to build liquidity
in anticipation of future growth initiatives. See ‘‘Income Taxes’’ below. During the year ended
December 31, 2009, we used $591.8 million less of cash for investing activities compared with the same
67