Hertz 2010 Annual Report Download - page 198
Download and view the complete annual report
Please find page 198 of the 2010 Hertz annual report below. You can navigate through the pages in the report by either clicking on the pages listed below, or by using the keyword search tool below to find specific information within the annual report.-
 1
1 -
2
-
3
-
4
-
5
-
6
-
7
-
8
-
9
-
10
-
11
-
12
-
13
-
14
-
15
-
16
-
17
-
18
-
19
-
20
-
21
-
22
-
23
-
24
-
25
-
26
-
27
-
28
-
29
-
30
-
31
-
32
-
33
-
34
-
35
-
36
-
37
-
38
-
39
-
40
-
41
-
42
-
43
-
44
-
45
-
46
-
47
-
48
-
49
-
50
-
51
-
52
-
53
-
54
-
55
-
56
-
57
-
58
-
59
-
60
-
61
-
62
-
63
-
64
-
65
-
66
-
67
-
68
-
69
-
70
-
71
-
72
-
73
-
74
-
75
-
76
-
77
-
78
-
79
-
80
-
81
-
82
-
83
-
84
-
85
-
86
-
87
-
88
-
89
-
90
-
91
-
92
-
93
-
94
-
95
-
96
-
97
-
98
-
99
-
100
-
101
-
102
-
103
-
104
-
105
-
106
-
107
-
108
-
109
-
110
-
111
-
112
-
113
-
114
-
115
-
116
-
117
-
118
-
119
-
120
-
121
-
122
-
123
-
124
-
125
-
126
-
127
-
128
-
129
-
130
-
131
-
132
-
133
-
134
-
135
-
136
-
137
-
138
-
139
-
140
-
141
-
142
-
143
-
144
-
145
-
146
-
147
-
148
-
149
-
150
-
151
-
152
-
153
-
154
-
155
-
156
-
157
-
158
-
159
-
160
-
161
-
162
-
163
-
164
-
165
-
166
-
167
-
168
-
169
-
170
-
171
-
172
-
173
-
174
-
175
-
176
-
177
-
178
-
179
-
180
-
181
-
182
-
183
-
184
-
185
-
186
-
187
-
 188
188 -
 189
189 -
 190
190 -
 191
191 -
 192
192 -
 193
193 -
 194
194 -
 195
195 -
 196
196 -
 197
197 -
 198
198 -
 199
199 -
 200
200
 |
 |

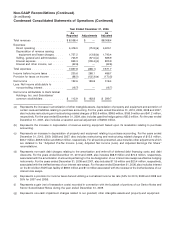
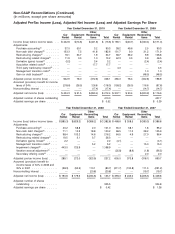
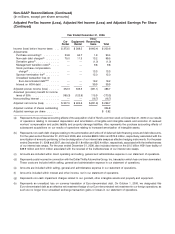
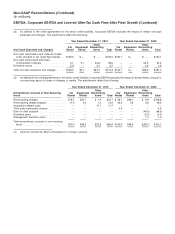
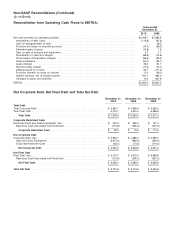
Non-GAAP Reconciliations (Continued)
(In millions)
Reconciliation from Operating Cash Flows to EBITDA:
Years ended
December 31,
2010 2009
Net cash provided by operating activities .......................................... $2,208.7 $1,693.3
Amortization of debt costs .................................................. (113.8) (97.3)
Gain on extinguishment of debt ............................................... — 48.5
Provision for losses on doubtful accounts ........................................ (19.7) (28.0)
Derivative gains (losses) ................................................... (10.8) 1.6
Gain on sale of property and equipment ......................................... 5.7 1.1
Amortization of cash flow hedges ............................................. (68.9) (74.6)
Stock-based compensation charges ............................................ (36.6) (35.5)
Asset writedowns ....................................................... (20.4) (36.1)
Lease charges ......................................................... 78.2 81.7
Noncontrolling interest .................................................... (17.4) (14.7)
Deferred taxes on income .................................................. 26.1 (111.2)
Provision (benefit) for taxes on income .......................................... 17.0 (59.7)
Interest expense, net of interest income .......................................... 761.1 664.3
Changes in assets and liabilities .............................................. 13.2 607.6
EBITDA ............................................................... $2,822.4 $2,641.0
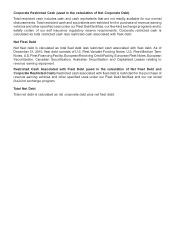
Net Corporate Debt, Net Fleet Debt and Total Net Debt
December 31, December 31, December 31,
2010 2009 2008
Total Debt
Total Corporate Debt .................................... $5,830.7 $ 4,689.4 $ 4,585.5
Total Fleet Debt ....................................... 5,475.7 5,675.0 6,386.8
Total Debt ....................................... $11,306.4 $10,364.4 $10,972.3
Corporate Restricted Cash
Restricted Cash and Cash Equivalents, less: ..................... $ 207.6 $ 365.2 $ 731.4
Restricted Cash Associated with Fleet Debt ..................... (115.6) (295.0) (557.2)
Corporate Restricted Cash ............................. $ 92.0 $ 70.2 $ 174.2
Net Corporate Debt
Corporate Debt, less: .................................... $5,830.7 $ 4,689.4 $ 4,585.5
Cash and Cash Equivalents .............................. (2,374.2) (985.6) (594.3)
Corporate Restricted Cash ............................... (92.0) (70.2) (174.2)
Net Corporate Debt ................................. $3,364.5 $ 3,633.6 $ 3,817.0
Net Fleet Debt
Fleet Debt, less: ....................................... $5,475.7 $ 5,675.0 $ 6,386.8
Restricted Cash Associated with Fleet Debt ..................... (115.6) (295.0) (557.2)
Net Fleet Debt ..................................... $5,360.1 $ 5,380.0 $ 5,829.6
Total Net Debt ....................................... $8,724.6 $ 9,013.6 $ 9,646.6