Hertz 2010 Annual Report Download - page 143
Download and view the complete annual report
Please find page 143 of the 2010 Hertz annual report below. You can navigate through the pages in the report by either clicking on the pages listed below, or by using the keyword search tool below to find specific information within the annual report.-
 1
1 -
2
-
3
-
4
-
5
-
6
-
7
-
8
-
9
-
10
-
11
-
12
-
13
-
14
-
15
-
16
-
17
-
18
-
19
-
20
-
21
-
22
-
23
-
24
-
25
-
26
-
27
-
28
-
29
-
30
-
31
-
32
-
33
-
34
-
35
-
36
-
37
-
38
-
39
-
40
-
41
-
42
-
43
-
44
-
45
-
46
-
47
-
48
-
49
-
50
-
51
-
52
-
53
-
54
-
55
-
56
-
57
-
58
-
59
-
60
-
61
-
62
-
63
-
64
-
65
-
66
-
67
-
68
-
69
-
70
-
71
-
72
-
73
-
74
-
75
-
76
-
77
-
78
-
79
-
80
-
81
-
82
-
83
-
84
-
85
-
86
-
87
-
88
-
89
-
90
-
91
-
92
-
93
-
94
-
95
-
96
-
97
-
98
-
99
-
100
-
101
-
102
-
103
-
104
-
105
-
106
-
107
-
108
-
109
-
110
-
111
-
112
-
113
-
114
-
115
-
116
-
117
-
118
-
119
-
120
-
121
-
122
-
123
-
124
-
125
-
126
-
127
-
128
-
129
-
130
-
131
-
132
-
 133
133 -
 134
134 -
 135
135 -
 136
136 -
 137
137 -
 138
138 -
 139
139 -
 140
140 -
 141
141 -
 142
142 -
 143
143 -
 144
144 -
 145
145 -
 146
146 -
 147
147 -
 148
148 -
 149
149 -
 150
150 -
 151
151 -
 152
152 -
 153
153 -
154
-
155
-
156
-
157
-
158
-
159
-
160
-
161
-
162
-
163
-
164
-
165
-
166
-
167
-
168
-
169
-
170
-
171
-
172
-
173
-
174
-
175
-
176
-
177
-
178
-
179
-
180
-
181
-
182
-
183
-
184
-
185
-
186
-
187
-
188
-
189
-
190
-
191
-
192
-
193
-
194
-
195
-
196
-
197
-
198
-
199
-
200
 |
 |

HERTZ GLOBAL HOLDINGS, INC. AND SUBSIDIARIES
NOTES TO CONSOLIDATED FINANCIAL STATEMENTS (Continued)
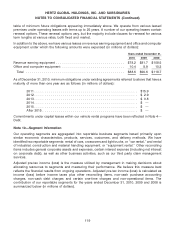
table of minimum future obligations appearing immediately above. We operate from various leased
premises under operating leases with terms up to 25 years. A number of our operating leases contain
renewal options. These renewal options vary, but the majority include clauses for renewal for various
term lengths at various rates, both fixed and market.
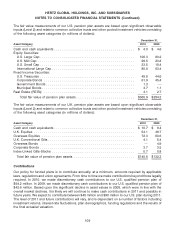
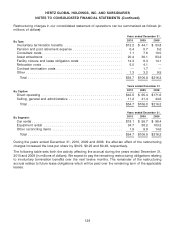
In addition to the above, we have various leases on revenue earning equipment and office and computer
equipment under which the following amounts were expensed (in millions of dollars):
Years ended December 31,
2010 2009 2008
Revenue earning equipment .................................. $78.2 $81.7 $108.5
Office and computer equipment ............................... 10.4 8.9 10.2
Total ................................................. $88.6 $90.6 $118.7
As of December 31, 2010, minimum obligations under existing agreements referred to above that have a
maturity of more than one year are as follows (in millions of dollars):
2011 ................................................... $15.9
2012 ................................................... $ 2.9
2013 ................................................... $ 0.8
2014 ................................................... $ —
2015 ................................................... $ —
After 2015 ............................................... $ —
Commitments under capital leases within our vehicle rental programs have been reflected in Note 4—
Debt.
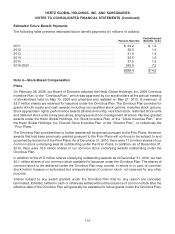
Note 10—Segment Information
Our operating segments are aggregated into reportable business segments based primarily upon
similar economic characteristics, products, services, customers, and delivery methods. We have
identified two reportable segments: rental of cars, crossovers and light trucks, or ‘‘car rental,’’ and rental
of industrial, construction and material handling equipment, or ‘‘equipment rental.’’ Other reconciling
items includes general corporate assets and expenses, certain interest expense (including net interest
on corporate debt), as well as other business activities, such as our third party claim management
services.
Adjusted pre-tax income (loss) is the measure utilized by management in making decisions about
allocating resources to segments and measuring their performance. We believe this measure best
reflects the financial results from ongoing operations. Adjusted pre-tax income (loss) is calculated as
income (loss) before income taxes plus other reconciling items, non-cash purchase accounting
charges, non-cash debt charges and certain one-time charges and non-operational items. The
contribution of our reportable segments for the years ended December 31, 2010, 2009 and 2008 is
summarized below (in millions of dollars).
119