Hertz 2010 Annual Report Download - page 78
Download and view the complete annual report
Please find page 78 of the 2010 Hertz annual report below. You can navigate through the pages in the report by either clicking on the pages listed below, or by using the keyword search tool below to find specific information within the annual report.-
 1
1 -
2
-
3
-
4
-
5
-
6
-
7
-
8
-
9
-
10
-
11
-
12
-
13
-
14
-
15
-
16
-
17
-
18
-
19
-
20
-
21
-
22
-
23
-
24
-
25
-
26
-
27
-
28
-
29
-
30
-
31
-
32
-
33
-
34
-
35
-
36
-
37
-
38
-
39
-
40
-
41
-
42
-
43
-
44
-
45
-
46
-
47
-
48
-
49
-
50
-
51
-
52
-
53
-
54
-
55
-
56
-
57
-
58
-
59
-
60
-
61
-
62
-
63
-
64
-
65
-
66
-
67
-
 68
68 -
 69
69 -
 70
70 -
 71
71 -
 72
72 -
 73
73 -
 74
74 -
 75
75 -
 76
76 -
 77
77 -
 78
78 -
 79
79 -
 80
80 -
 81
81 -
 82
82 -
 83
83 -
 84
84 -
 85
85 -
 86
86 -
 87
87 -
 88
88 -
89
-
90
-
91
-
92
-
93
-
94
-
95
-
96
-
97
-
98
-
99
-
100
-
101
-
102
-
103
-
104
-
105
-
106
-
107
-
108
-
109
-
110
-
111
-
112
-
113
-
114
-
115
-
116
-
117
-
118
-
119
-
120
-
121
-
122
-
123
-
124
-
125
-
126
-
127
-
128
-
129
-
130
-
131
-
132
-
133
-
134
-
135
-
136
-
137
-
138
-
139
-
140
-
141
-
142
-
143
-
144
-
145
-
146
-
147
-
148
-
149
-
150
-
151
-
152
-
153
-
154
-
155
-
156
-
157
-
158
-
159
-
160
-
161
-
162
-
163
-
164
-
165
-
166
-
167
-
168
-
169
-
170
-
171
-
172
-
173
-
174
-
175
-
176
-
177
-
178
-
179
-
180
-
181
-
182
-
183
-
184
-
185
-
186
-
187
-
188
-
189
-
190
-
191
-
192
-
193
-
194
-
195
-
196
-
197
-
198
-
199
-
200
 |
 |

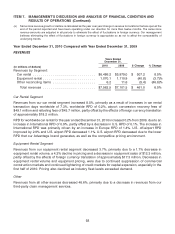
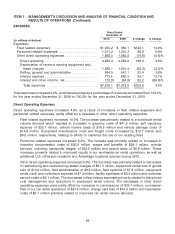
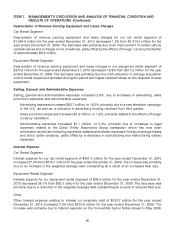
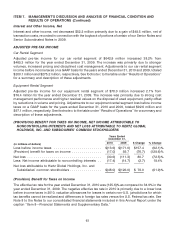
ITEM 7. MANAGEMENT’S DISCUSSION AND ANALYSIS OF FINANCIAL CONDITION AND
RESULTS OF OPERATIONS (Continued)
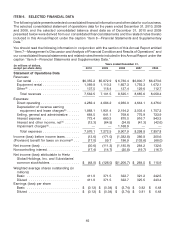
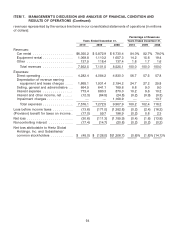
revenues represented by the various line items in our consolidated statements of operations (in millions
of dollars):
Percentage of Revenues
Years Ended December 31, Years Ended December 31,
2010 2009 2008 2010 2009 2008
Revenues:
Car rental .................... $6,355.2 $ 5,872.9 $ 6,730.4 84.0% 82.7% 79.0%
Equipment rental ............... 1,069.8 1,110.2 1,657.3 14.2 15.6 19.4
Other ....................... 137.5 118.4 137.4 1.8 1.7 1.6
Total revenues ............... 7,562.5 7,101.5 8,525.1 100.0 100.0 100.0
Expenses:
Direct operating ................ 4,282.4 4,084.2 4,930.0 56.7 57.5 57.8
Depreciation of revenue earning
equipment and lease charges .... 1,868.1 1,931.4 2,194.2 24.7 27.2 25.8
Selling, general and administrative . . 664.5 641.1 769.6 8.8 9.0 9.0
Interest expense ............... 773.4 680.3 870.0 10.2 9.6 10.2
Interest and other income, net ..... (12.3) (64.5) (24.8) (0.2) (0.9) (0.3)
Impairment charges ............. — — 1,168.9 — — 13.7
Total expenses ............... 7,576.1 7,272.5 9,907.9 100.2 102.4 116.2
Loss before income taxes .......... (13.6) (171.0) (1,382.8) (0.2) (2.4) (16.2)
(Provision) benefit for taxes on income . (17.0) 59.7 196.9 (0.2) 0.8 2.3
Net loss ....................... (30.6) (111.3) (1,185.9) (0.4) (1.6) (13.9)
Noncontrolling interest ............ (17.4) (14.7) (20.8) (0.2) (0.2) (0.2)
Net loss attributable to Hertz Global
Holdings, Inc. and Subsidiaries’
common stockholders ........... $ (48.0) $ (126.0) $(1,206.7) (0.6)% (1.8)% (14.1)%
54