Hertz 2010 Annual Report Download - page 28
Download and view the complete annual report
Please find page 28 of the 2010 Hertz annual report below. You can navigate through the pages in the report by either clicking on the pages listed below, or by using the keyword search tool below to find specific information within the annual report.-
 1
1 -
2
-
3
-
4
-
5
-
6
-
7
-
8
-
9
-
10
-
11
-
12
-
13
-
14
-
15
-
16
-
17
-
 18
18 -
 19
19 -
 20
20 -
 21
21 -
 22
22 -
 23
23 -
 24
24 -
 25
25 -
 26
26 -
 27
27 -
 28
28 -
 29
29 -
 30
30 -
 31
31 -
 32
32 -
 33
33 -
 34
34 -
 35
35 -
 36
36 -
 37
37 -
 38
38 -
39
-
40
-
41
-
42
-
43
-
44
-
45
-
46
-
47
-
48
-
49
-
50
-
51
-
52
-
53
-
54
-
55
-
56
-
57
-
58
-
59
-
60
-
61
-
62
-
63
-
64
-
65
-
66
-
67
-
68
-
69
-
70
-
71
-
72
-
73
-
74
-
75
-
76
-
77
-
78
-
79
-
80
-
81
-
82
-
83
-
84
-
85
-
86
-
87
-
88
-
89
-
90
-
91
-
92
-
93
-
94
-
95
-
96
-
97
-
98
-
99
-
100
-
101
-
102
-
103
-
104
-
105
-
106
-
107
-
108
-
109
-
110
-
111
-
112
-
113
-
114
-
115
-
116
-
117
-
118
-
119
-
120
-
121
-
122
-
123
-
124
-
125
-
126
-
127
-
128
-
129
-
130
-
131
-
132
-
133
-
134
-
135
-
136
-
137
-
138
-
139
-
140
-
141
-
142
-
143
-
144
-
145
-
146
-
147
-
148
-
149
-
150
-
151
-
152
-
153
-
154
-
155
-
156
-
157
-
158
-
159
-
160
-
161
-
162
-
163
-
164
-
165
-
166
-
167
-
168
-
169
-
170
-
171
-
172
-
173
-
174
-
175
-
176
-
177
-
178
-
179
-
180
-
181
-
182
-
183
-
184
-
185
-
186
-
187
-
188
-
189
-
190
-
191
-
192
-
193
-
194
-
195
-
196
-
197
-
198
-
199
-
200
 |
 |
ITEM 1. BUSINESS (Continued)
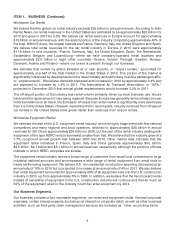
Worldwide Car Rental
We believe that the global car rental industry exceeds $35 billion in annual revenues. According to Auto
Rental News, car rental revenues in the United States are estimated to be approximately $20 billion for
2010 and grew in 2010 by 2.5%. We believe car rental revenues in Europe account for approximately
$15 billion in annual revenues, with the airport portion of the industry comprising approximately 40% of
the total. Within Europe, the largest markets are France, Germany, Italy, the United Kingdom and Spain.
We believe total rental revenues for the car rental industry in Europe in 2010 were approximately
$11.8 billion in nine countries—France, Germany, Italy, the United Kingdom, Spain, The Netherlands,
Switzerland, Belgium and Luxembourg—where we have company-operated rental locations and
approximately $2.6 billion in eight other countries—Greece, Ireland, Portugal, Sweden, Norway,
Denmark, Austria and Finland—where our brand is present through our licensees.
We estimate that rentals by airline travelers at or near airports, or ‘‘airport rentals,’’ accounted for
approximately one-half of the total market in the United States in 2010. This portion of the market is
significantly influenced by developments in the travel industry and particularly in airline passenger traffic,
or ‘‘enplanements.’’ We believe domestic enplanements increased in 2010 by approximately 0.4% and
are expected to increase by 1.8% in 2011. The International Air Transport Association, or ‘‘IATA,’’
projected in December 2010 that annual global enplanements would increase 5.2% in 2011.
The off-airport portion of the industry has rental volume primarily driven by local business use, leisure
travel and the replacement of cars being repaired. Because Europe has generally demonstrated a lower
historical reliance on air travel, the European off-airport car rental market is significantly more developed
than it is in the United States. However, we believe that in recent years, industry revenues from off-airport
car rentals in the United States have grown faster than revenues from airport rentals.
Worldwide Equipment Rental
We estimate the size of the U.S. equipment rental industry, which is highly fragmented with few national
competitors and many regional and local operators, declined to approximately $28 billion in annual
revenues for 2010 from approximately $29 billion in 2009, but the part of the rental industry dealing with
equipment of the type HERC rents is somewhat smaller than that. We believe that the industry grew at a
1.7% compound annual growth rate between 2000 and 2010. Other market data indicates that the
equipment rental industries in France, Spain, Italy and China generate approximately $4.5 billion,
$2.5 billion, $2.1 billion and $5.1 billion in annual revenues, respectively, although the portions of those
markets in which HERC competes are smaller.
The equipment rental industry serves a broad range of customers from small local contractors to large
industrial national accounts and encompasses a wide range of rental equipment from small tools to
heavy earthmoving equipment. We believe U.S. non-residential construction spending decreased at an
annual rate of 10% in 2010 but is projected to increase at an annual rate of 4% in 2011. We also believe
that rental equipment accounted for approximately 40% of all equipment sold into the U.S. construction
industry in 2010, up from approximately 5% in 1993. In addition, we believe that the trend toward rental
instead of ownership of equipment in the U.S. construction industry will continue and that as much as
50% of the equipment used in the industry could be rental equipment by 2014.
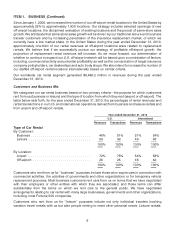
Our Business Segments
Our business consists of two reportable segments, car rental and equipment rental. General corporate
expenses, certain interest expense (including net interest on corporate debt), as well as other business
activities, such as third-party claim management services are included as ‘‘other reconciling items.’’
4