Hertz 2010 Annual Report Download - page 41
Download and view the complete annual report
Please find page 41 of the 2010 Hertz annual report below. You can navigate through the pages in the report by either clicking on the pages listed below, or by using the keyword search tool below to find specific information within the annual report.-
 1
1 -
2
-
3
-
4
-
5
-
6
-
7
-
8
-
9
-
10
-
11
-
12
-
13
-
14
-
15
-
16
-
17
-
18
-
19
-
20
-
21
-
22
-
23
-
24
-
25
-
26
-
27
-
28
-
29
-
30
-
 31
31 -
 32
32 -
 33
33 -
 34
34 -
 35
35 -
 36
36 -
 37
37 -
 38
38 -
 39
39 -
 40
40 -
 41
41 -
 42
42 -
 43
43 -
 44
44 -
 45
45 -
 46
46 -
 47
47 -
 48
48 -
 49
49 -
 50
50 -
 51
51 -
52
-
53
-
54
-
55
-
56
-
57
-
58
-
59
-
60
-
61
-
62
-
63
-
64
-
65
-
66
-
67
-
68
-
69
-
70
-
71
-
72
-
73
-
74
-
75
-
76
-
77
-
78
-
79
-
80
-
81
-
82
-
83
-
84
-
85
-
86
-
87
-
88
-
89
-
90
-
91
-
92
-
93
-
94
-
95
-
96
-
97
-
98
-
99
-
100
-
101
-
102
-
103
-
104
-
105
-
106
-
107
-
108
-
109
-
110
-
111
-
112
-
113
-
114
-
115
-
116
-
117
-
118
-
119
-
120
-
121
-
122
-
123
-
124
-
125
-
126
-
127
-
128
-
129
-
130
-
131
-
132
-
133
-
134
-
135
-
136
-
137
-
138
-
139
-
140
-
141
-
142
-
143
-
144
-
145
-
146
-
147
-
148
-
149
-
150
-
151
-
152
-
153
-
154
-
155
-
156
-
157
-
158
-
159
-
160
-
161
-
162
-
163
-
164
-
165
-
166
-
167
-
168
-
169
-
170
-
171
-
172
-
173
-
174
-
175
-
176
-
177
-
178
-
179
-
180
-
181
-
182
-
183
-
184
-
185
-
186
-
187
-
188
-
189
-
190
-
191
-
192
-
193
-
194
-
195
-
196
-
197
-
198
-
199
-
200
 |
 |
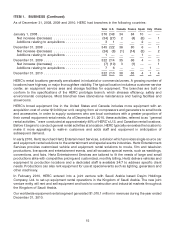
ITEM 1. BUSINESS (Continued)
operations in the United States represented approximately 65% of our worldwide equipment rental
revenues during the year ended December 31, 2010. In the United States and Canada, the other top
national-scale industry participants are United Rentals, Inc., or ‘‘URI,’’ RSC Equipment Rental, Inc., or
‘‘RSC,’’ and Sunbelt Rentals. A number of individual Caterpillar dealers also participate in the equipment
rental market in the United States, Canada, France, Spain and Italy. In France, the other principal
national-scale industry participants are Loxam, Kiloutou and Laho. Aggreko also participates in the
power generation rental markets in France, Spain and Italy.
Competition in the equipment rental industry is intense, and it often takes the form of price competition.
HERC’s competitors, some of which may have access to substantial capital, may seek to compete
aggressively on the basis of pricing. To the extent that HERC matches downward competitor pricing
without reducing our operating costs, it could have an adverse impact on our results of operations. We
believe that HERC’s competitive success has been primarily the product of its more than 40 years of
experience in the equipment rental industry, its systems and procedures for monitoring, controlling and
developing its branch network, its capacity to maintain a comprehensive rental fleet, the quality of its
sales force and its established national accounts program.
Other Operations
Our wholly-owned subsidiary, Hertz Claim Management Corporation, or ‘‘HCM,’’ provides claim
administration services to us and, to a lesser extent, to third parties. These services include investigating,
evaluating, negotiating and disposing of a wide variety of claims, including third-party, first-party, bodily
injury, property damage, general liability and product liability, but not the underwriting of risks. HCM
conducts business at five regional offices in the United States. Separate subsidiaries of ours conduct
similar operations in seven countries in Europe.
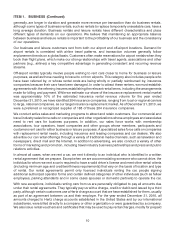
Seasonality
Generally, car rental and equipment rental are seasonal businesses, with decreased levels of business in
the winter months and heightened activity during spring and summer. To accommodate increased
demand, we increase our available fleet and staff during the second and third quarters of the year. As
business demand declines, fleet and staff are decreased accordingly. However, certain operating
expenses, including real estate taxes, rent, insurance, utilities, maintenance and other facility-related
expenses, the costs of operating our information technology systems and minimum staffing costs,
remain fixed and cannot be adjusted for seasonal demand. See ‘‘Item 1A—Risk Factors’’ in this Annual
Report. The following tables set forth this seasonal effect by providing quarterly revenues for each of the
quarters in the years ended December 31, 2010 and 2009.
17