Hertz 2010 Annual Report Download - page 82
Download and view the complete annual report
Please find page 82 of the 2010 Hertz annual report below. You can navigate through the pages in the report by either clicking on the pages listed below, or by using the keyword search tool below to find specific information within the annual report.-
 1
1 -
2
-
3
-
4
-
5
-
6
-
7
-
8
-
9
-
10
-
11
-
12
-
13
-
14
-
15
-
16
-
17
-
18
-
19
-
20
-
21
-
22
-
23
-
24
-
25
-
26
-
27
-
28
-
29
-
30
-
31
-
32
-
33
-
34
-
35
-
36
-
37
-
38
-
39
-
40
-
41
-
42
-
43
-
44
-
45
-
46
-
47
-
48
-
49
-
50
-
51
-
52
-
53
-
54
-
55
-
56
-
57
-
58
-
59
-
60
-
61
-
62
-
63
-
64
-
65
-
66
-
67
-
68
-
69
-
70
-
71
-
 72
72 -
 73
73 -
 74
74 -
 75
75 -
 76
76 -
 77
77 -
 78
78 -
 79
79 -
 80
80 -
 81
81 -
 82
82 -
 83
83 -
 84
84 -
 85
85 -
 86
86 -
 87
87 -
 88
88 -
 89
89 -
 90
90 -
 91
91 -
 92
92 -
93
-
94
-
95
-
96
-
97
-
98
-
99
-
100
-
101
-
102
-
103
-
104
-
105
-
106
-
107
-
108
-
109
-
110
-
111
-
112
-
113
-
114
-
115
-
116
-
117
-
118
-
119
-
120
-
121
-
122
-
123
-
124
-
125
-
126
-
127
-
128
-
129
-
130
-
131
-
132
-
133
-
134
-
135
-
136
-
137
-
138
-
139
-
140
-
141
-
142
-
143
-
144
-
145
-
146
-
147
-
148
-
149
-
150
-
151
-
152
-
153
-
154
-
155
-
156
-
157
-
158
-
159
-
160
-
161
-
162
-
163
-
164
-
165
-
166
-
167
-
168
-
169
-
170
-
171
-
172
-
173
-
174
-
175
-
176
-
177
-
178
-
179
-
180
-
181
-
182
-
183
-
184
-
185
-
186
-
187
-
188
-
189
-
190
-
191
-
192
-
193
-
194
-
195
-
196
-
197
-
198
-
199
-
200
 |
 |

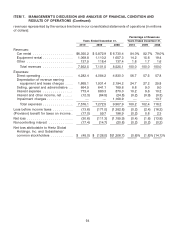
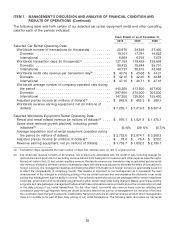
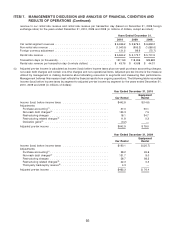
ITEM 7. MANAGEMENT’S DISCUSSION AND ANALYSIS OF FINANCIAL CONDITION AND
RESULTS OF OPERATIONS (Continued)
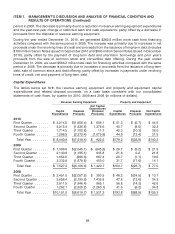
(e) Same store revenue growth or decline is calculated as the year over year change in revenue for locations that are open at the
end of the period reported and have been operating under our direction for more than twelve months. The same store
revenue amounts are adjusted in all periods to eliminate the effect of fluctuations in foreign currency. Our management
believes eliminating the effect of fluctuations in foreign currency is appropriate so as not to affect the comparability of
underlying trends.
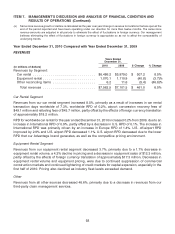
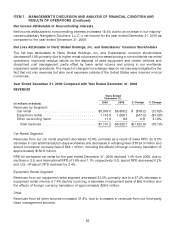
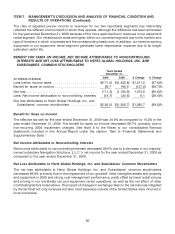
Year Ended December 31, 2010 Compared with Year Ended December 31, 2009
REVENUES
Years Ended
December 31,
2010 2009 $ Change % Change
(in millions of dollars)
Revenues by Segment:
Car rental ............................... $6,486.2 $5,979.0 $ 507.2 8.5%
Equipment rental .......................... 1,070.1 1,110.9 (40.8) (3.7)%
Other reconciling items ..................... 6.2 11.6 (5.4) (46.6)%
Total revenues .......................... $7,562.5 $7,101.5 $ 461.0 6.5%
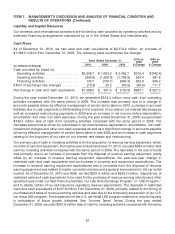
Car Rental Segment
Revenues from our car rental segment increased 8.5%, primarily as a result of increases in car rental
transaction days worldwide of 7.3%, worldwide RPD of 0.2%, airport concession recovery fees of
$49.1 million and refueling fees of $43.7 million, partly offset by the effects of foreign currency translation
of approximately $18.2 million.
RPD for worldwide car rental for the year ended December 31, 2010 increased 0.2% from 2009, due to an
increase in International RPD of 0.9%, partly offset by a decrease in U.S. RPD of 0.1%. The increase in
International RPD was primarily driven by an increase in Europe RPD of 1.4%. U.S. off-airport RPD
improved by 2.9% and U.S. airport RPD decreased 1.1%. U.S. airport RPD decreased due to the lower
RPD that our Advantage brand generates, as well as the competitive pricing environment.
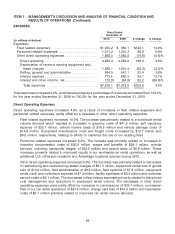
Equipment Rental Segment
Revenues from our equipment rental segment decreased 3.7%, primarily due to a 1.7% decrease in
equipment rental volume, a 4.2% decline in pricing and a decrease in equipment sales of $12.3 million,
partly offset by the effects of foreign currency translation of approximately $17.3 million. Decreases in
equipment rental volume and equipment pricing, were due to continued suppression of commercial
construction markets and continued tightening of credit markets for capital expansion, especially in the
first half of 2010. Pricing also declined as industry fleet levels exceeded demand.
Other
Revenues from all other sources decreased 46.6%, primarily due to a decrease in revenues from our
third-party claim management services.
58