Hertz 2010 Annual Report Download - page 86
Download and view the complete annual report
Please find page 86 of the 2010 Hertz annual report below. You can navigate through the pages in the report by either clicking on the pages listed below, or by using the keyword search tool below to find specific information within the annual report.-
 1
1 -
2
-
3
-
4
-
5
-
6
-
7
-
8
-
9
-
10
-
11
-
12
-
13
-
14
-
15
-
16
-
17
-
18
-
19
-
20
-
21
-
22
-
23
-
24
-
25
-
26
-
27
-
28
-
29
-
30
-
31
-
32
-
33
-
34
-
35
-
36
-
37
-
38
-
39
-
40
-
41
-
42
-
43
-
44
-
45
-
46
-
47
-
48
-
49
-
50
-
51
-
52
-
53
-
54
-
55
-
56
-
57
-
58
-
59
-
60
-
61
-
62
-
63
-
64
-
65
-
66
-
67
-
68
-
69
-
70
-
71
-
72
-
73
-
74
-
75
-
 76
76 -
 77
77 -
 78
78 -
 79
79 -
 80
80 -
 81
81 -
 82
82 -
 83
83 -
 84
84 -
 85
85 -
 86
86 -
 87
87 -
 88
88 -
 89
89 -
 90
90 -
 91
91 -
 92
92 -
 93
93 -
 94
94 -
 95
95 -
 96
96 -
97
-
98
-
99
-
100
-
101
-
102
-
103
-
104
-
105
-
106
-
107
-
108
-
109
-
110
-
111
-
112
-
113
-
114
-
115
-
116
-
117
-
118
-
119
-
120
-
121
-
122
-
123
-
124
-
125
-
126
-
127
-
128
-
129
-
130
-
131
-
132
-
133
-
134
-
135
-
136
-
137
-
138
-
139
-
140
-
141
-
142
-
143
-
144
-
145
-
146
-
147
-
148
-
149
-
150
-
151
-
152
-
153
-
154
-
155
-
156
-
157
-
158
-
159
-
160
-
161
-
162
-
163
-
164
-
165
-
166
-
167
-
168
-
169
-
170
-
171
-
172
-
173
-
174
-
175
-
176
-
177
-
178
-
179
-
180
-
181
-
182
-
183
-
184
-
185
-
186
-
187
-
188
-
189
-
190
-
191
-
192
-
193
-
194
-
195
-
196
-
197
-
198
-
199
-
200
 |
 |

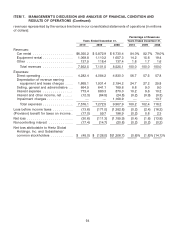
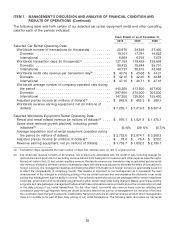
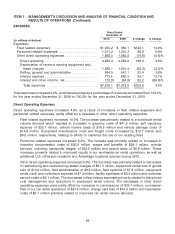
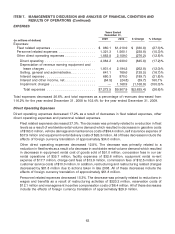
ITEM 7. MANAGEMENT’S DISCUSSION AND ANALYSIS OF FINANCIAL CONDITION AND
RESULTS OF OPERATIONS (Continued)
Net Income Attributable to Noncontrolling Interests
Net income attributable to noncontrolling interests increased 18.4% due to an increase in our majority-
owned subsidiary Navigation Solutions, L.L.C.’s net income for the year ended December 31, 2010 as
compared to the year ended December 31, 2009.
Net Loss Attributable to Hertz Global Holdings, Inc. and Subsidiaries’ Common Stockholders
The net loss attributable to Hertz Global Holdings, Inc. and Subsidiaries’ common stockholders
decreased 61.9% primarily due to higher rental volume and increased pricing in our worldwide car rental
operations, improved residual values on the disposal of used equipment and certain vehicles and
disciplined cost management, partly offset by lower rental volume and pricing in our worldwide
equipment rental operations. The impact of changes in exchange rates on net loss was mitigated by the
fact that not only revenues but also most expenses outside of the United States were incurred in local
currencies.
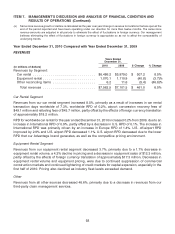
Year Ended December 31, 2009 Compared with Year Ended December 31, 2008
REVENUES
Years Ended
December 31,
2009 2008 $ Change % Change
(in millions of dollars)
Revenues by Segment:
Car rental ............................... $5,979.0 $6,858.2 $ (879.2) (12.8)%
Equipment rental .......................... 1,110.9 1,658.1 (547.2) (33.0)%
Other reconciling items ..................... 11.6 8.8 2.8 31.8%
Total revenues .......................... $7,101.5 $8,525.1 $(1,423.6) (16.7)%
Car Rental Segment
Revenues from our car rental segment decreased 12.8%, primarily as a result of lower RPD, an 8.0%
decrease in car rental transaction days worldwide and decreases in refueling fees of $124.3 million and
airport concession recovery fees of $54.1 million, including the effects of foreign currency translation of
approximately $156.9 million.
RPD for worldwide car rental for the year ended December 31, 2009 declined 1.4% from 2008, due to
declines in U.S. and International RPD of 1.6% and 1.1%, respectively. U.S. airport RPD decreased 0.2%
and U.S. off-airport RPD declined by 2.4%.
Equipment Rental Segment
Revenues from our equipment rental segment decreased 33.0%, primarily due to a 27.2% decrease in
equipment rental volume, a 7.4% decline in pricing, a decrease in equipment sales of $65.4 million and
the effects of foreign currency translation of approximately $26.9 million.
Other
Revenues from all other sources increased 31.8%, due to increases in revenues from our third-party
claim management services.
62