Hertz 2010 Annual Report Download - page 138
Download and view the complete annual report
Please find page 138 of the 2010 Hertz annual report below. You can navigate through the pages in the report by either clicking on the pages listed below, or by using the keyword search tool below to find specific information within the annual report.-
 1
1 -
2
-
3
-
4
-
5
-
6
-
7
-
8
-
9
-
10
-
11
-
12
-
13
-
14
-
15
-
16
-
17
-
18
-
19
-
20
-
21
-
22
-
23
-
24
-
25
-
26
-
27
-
28
-
29
-
30
-
31
-
32
-
33
-
34
-
35
-
36
-
37
-
38
-
39
-
40
-
41
-
42
-
43
-
44
-
45
-
46
-
47
-
48
-
49
-
50
-
51
-
52
-
53
-
54
-
55
-
56
-
57
-
58
-
59
-
60
-
61
-
62
-
63
-
64
-
65
-
66
-
67
-
68
-
69
-
70
-
71
-
72
-
73
-
74
-
75
-
76
-
77
-
78
-
79
-
80
-
81
-
82
-
83
-
84
-
85
-
86
-
87
-
88
-
89
-
90
-
91
-
92
-
93
-
94
-
95
-
96
-
97
-
98
-
99
-
100
-
101
-
102
-
103
-
104
-
105
-
106
-
107
-
108
-
109
-
110
-
111
-
112
-
113
-
114
-
115
-
116
-
117
-
118
-
119
-
120
-
121
-
122
-
123
-
124
-
125
-
126
-
127
-
 128
128 -
 129
129 -
 130
130 -
 131
131 -
 132
132 -
 133
133 -
 134
134 -
 135
135 -
 136
136 -
 137
137 -
 138
138 -
 139
139 -
 140
140 -
 141
141 -
 142
142 -
 143
143 -
 144
144 -
 145
145 -
 146
146 -
 147
147 -
 148
148 -
149
-
150
-
151
-
152
-
153
-
154
-
155
-
156
-
157
-
158
-
159
-
160
-
161
-
162
-
163
-
164
-
165
-
166
-
167
-
168
-
169
-
170
-
171
-
172
-
173
-
174
-
175
-
176
-
177
-
178
-
179
-
180
-
181
-
182
-
183
-
184
-
185
-
186
-
187
-
188
-
189
-
190
-
191
-
192
-
193
-
194
-
195
-
196
-
197
-
198
-
199
-
200
 |
 |

HERTZ GLOBAL HOLDINGS, INC. AND SUBSIDIARIES
NOTES TO CONSOLIDATED FINANCIAL STATEMENTS (Continued)
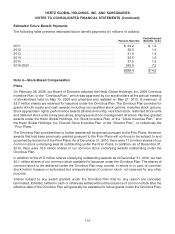
other period established by the Committee) through a payroll deduction. The maximum and minimum
contributions that an eligible employee may make under all of our qualified employee stock purchase
plans will be determined by the Committee, provided that no employee may be permitted to purchase
stock with an aggregate fair market value greater than $25,000 per year. At the end of the offering period,
the total amount of each employee’s payroll deduction will be used to purchase shares of our common
stock. The purchase price per share will be not less than 85% of the market price of our common stock
on the date of purchase; the exact percentage for each offering period will be set in advance by the
Committee.
For the years ended December 31, 2010, 2009 and 2008, we recognized compensation cost of
approximately $0.6 million ($0.3 million, net of tax), $0.5 million ($0.3 million, net of tax) and $0.1 million
($0.1 million, net of tax), respectively, for the amount of the discount on the stock purchased by our
employees under the ESPP. Approximately 1,500 employees participated in the ESPP as of
December 31, 2010.
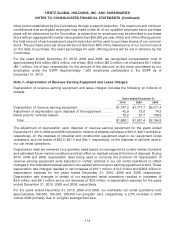
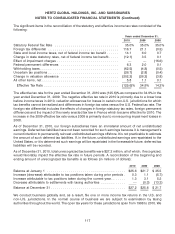
Note 7—Depreciation of Revenue Earning Equipment and Lease Charges
Depreciation of revenue earning equipment and lease charges includes the following (in millions of
dollars):
Years ended December 31,
2010 2009 2008
Depreciation of revenue earning equipment ................. $1,747.0 $1,777.7 $2,011.4
Adjustment of depreciation upon disposal of the equipment ..... 42.9 72.0 74.3
Rents paid for vehicles leased ........................... 78.2 81.7 108.5
Total ............................................ $1,868.1 $1,931.4 $2,194.2
The adjustment of depreciation upon disposal of revenue earning equipment for the years ended
December 31, 2010, 2009 and 2008 included (in millions of dollars) net losses of $10.0, $40.7 and $30.2,
respectively, on the disposal of industrial and construction equipment used in our equipment rental
operations, and net losses of $32.9, $31.3 and $44.1, respectively, on the disposal of vehicles used in
our car rental operations.
Depreciation rates are reviewed on a quarterly basis based on management’s routine review of present
and estimated future market conditions and their effect on residual values at the time of disposal. During
2010, 2009 and 2008, depreciation rates being used to compute the provision for depreciation of
revenue earning equipment were adjusted on certain vehicles in our car rental operations to reflect
changes in the estimated residual values to be realized when revenue earning equipment is sold. These
depreciation rate changes resulted in net increases of $19.1 million, $13.2 million and $36.6 million in
depreciation expense for the years ended December 31, 2010, 2009 and 2008, respectively.
Depreciation rate changes in certain of our equipment rental operations resulted in increases of
$3.6 million and $6.1 million and a net decrease of $3.9 million in depreciation expense for the years
ended December 31, 2010, 2009 and 2008, respectively.
For the years ended December 31, 2010, 2009 and 2008, our worldwide car rental operations sold
approximately 158,500, 154,300, 189,300 non-program cars, respectively, a 2.7% increase in 2010
versus 2009 primarily due to a higher average fleet size.
114