Hertz 2010 Annual Report Download - page 146
Download and view the complete annual report
Please find page 146 of the 2010 Hertz annual report below. You can navigate through the pages in the report by either clicking on the pages listed below, or by using the keyword search tool below to find specific information within the annual report.-
 1
1 -
2
-
3
-
4
-
5
-
6
-
7
-
8
-
9
-
10
-
11
-
12
-
13
-
14
-
15
-
16
-
17
-
18
-
19
-
20
-
21
-
22
-
23
-
24
-
25
-
26
-
27
-
28
-
29
-
30
-
31
-
32
-
33
-
34
-
35
-
36
-
37
-
38
-
39
-
40
-
41
-
42
-
43
-
44
-
45
-
46
-
47
-
48
-
49
-
50
-
51
-
52
-
53
-
54
-
55
-
56
-
57
-
58
-
59
-
60
-
61
-
62
-
63
-
64
-
65
-
66
-
67
-
68
-
69
-
70
-
71
-
72
-
73
-
74
-
75
-
76
-
77
-
78
-
79
-
80
-
81
-
82
-
83
-
84
-
85
-
86
-
87
-
88
-
89
-
90
-
91
-
92
-
93
-
94
-
95
-
96
-
97
-
98
-
99
-
100
-
101
-
102
-
103
-
104
-
105
-
106
-
107
-
108
-
109
-
110
-
111
-
112
-
113
-
114
-
115
-
116
-
117
-
118
-
119
-
120
-
121
-
122
-
123
-
124
-
125
-
126
-
127
-
128
-
129
-
130
-
131
-
132
-
133
-
134
-
135
-
 136
136 -
 137
137 -
 138
138 -
 139
139 -
 140
140 -
 141
141 -
 142
142 -
 143
143 -
 144
144 -
 145
145 -
 146
146 -
 147
147 -
 148
148 -
 149
149 -
 150
150 -
 151
151 -
 152
152 -
 153
153 -
 154
154 -
 155
155 -
 156
156 -
157
-
158
-
159
-
160
-
161
-
162
-
163
-
164
-
165
-
166
-
167
-
168
-
169
-
170
-
171
-
172
-
173
-
174
-
175
-
176
-
177
-
178
-
179
-
180
-
181
-
182
-
183
-
184
-
185
-
186
-
187
-
188
-
189
-
190
-
191
-
192
-
193
-
194
-
195
-
196
-
197
-
198
-
199
-
200
 |
 |

HERTZ GLOBAL HOLDINGS, INC. AND SUBSIDIARIES
NOTES TO CONSOLIDATED FINANCIAL STATEMENTS (Continued)
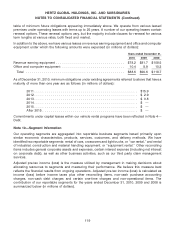
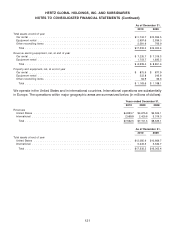
As of December 31,
2010 2009
Revenue earning equipment, net, at end of year
United States ..................................................... $ 6,404.1 $ 6,432.3
International ...................................................... 2,535.3 2,419.3
Total .......................................................... $ 8,939.4 $ 8,851.6
Property and equipment, net, at end of year
United States ..................................................... $ 947.1 $ 953.7
International ...................................................... 216.5 234.4
Total .......................................................... $ 1,163.6 $ 1,188.1
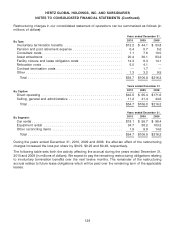
(a) The following table reconciles adjusted pre-tax income to loss before income taxes for the years ended December 31, 2010,
2009 and 2008 (in millions of dollars):
Years ended December 31,
2010 2009 2008
Adjusted pre-tax income
Car rental ....................................... $642.9 $ 465.3 $ 289.1
Equipment rental ................................... 78.0 76.4 272.0
Total reportable segments ............................ 720.9 541.7 561.1
Adjustments:
Other reconciling items(1) .............................. (372.8) (342.8) (323.9)
Purchase accounting(2) ............................... (90.3) (90.3) (101.0)
Non-cash debt charges(3) .............................. (182.6) (171.9) (100.2)
Restructuring charges ................................ (54.7) (106.8) (216.2)
Restructuring related charges(4) .......................... (13.2) (46.5) (26.3)
Impairment charges(5) ................................ — — (1,168.9)
Management transition costs ........................... — (1.0) (5.2)
Derivative gains (losses)(6) ............................. (3.2) 2.4 (2.2)
Gain on debt buyback(7) .............................. — 48.5 —
Third-party bankruptcy accrual(8) ......................... — (4.3) —
Acquisition related costs(9) ............................. (17.7) — —
Loss before income taxes ............................... $(13.6) $(171.0) $(1,382.8)
(1) Represents general corporate expenses, certain interest expense (including net interest on corporate debt), as well
as other business activities such as our third-party claim management services.
(2) Represents the purchase accounting effects of the Acquisition on our results of operations relating to increased
depreciation and amortization of tangible and intangible assets and accretion of revalued workers’ compensation
and public liability and property damage liabilities. Also represents the purchase accounting effects of subsequent
acquisitions on our results of operations relating to increased amortization of intangible assets.
(3) Represents non-cash debt charges relating to the amortization and write-off of deferred debt financing costs and
debt discounts. For the years ended December 31, 2010 and 2009, also includes $68.9 million and $74.6 million,
respectively, associated with the amortization of amounts pertaining to the de-designation of the HVF interest rate
swaps as effective hedging instruments. During the year ended December 31, 2008, also includes $11.8 million
associated with the ineffectiveness of our HVF interest rate swaps and $30.0 million related to the write-off of
deferred financing costs associated with those countries outside the United States as to which take-out asset-based
facilities have not been entered into.
(4) Represents incremental costs incurred directly supporting our business transformation initiatives. Such costs
include transition costs incurred in connection with our business process outsourcing arrangements and
incremental costs incurred to facilitate business process re-engineering initiatives that involve significant
organization redesign and extensive operational process changes.
122