Hertz 2010 Annual Report Download - page 109
Download and view the complete annual report
Please find page 109 of the 2010 Hertz annual report below. You can navigate through the pages in the report by either clicking on the pages listed below, or by using the keyword search tool below to find specific information within the annual report.-
 1
1 -
2
-
3
-
4
-
5
-
6
-
7
-
8
-
9
-
10
-
11
-
12
-
13
-
14
-
15
-
16
-
17
-
18
-
19
-
20
-
21
-
22
-
23
-
24
-
25
-
26
-
27
-
28
-
29
-
30
-
31
-
32
-
33
-
34
-
35
-
36
-
37
-
38
-
39
-
40
-
41
-
42
-
43
-
44
-
45
-
46
-
47
-
48
-
49
-
50
-
51
-
52
-
53
-
54
-
55
-
56
-
57
-
58
-
59
-
60
-
61
-
62
-
63
-
64
-
65
-
66
-
67
-
68
-
69
-
70
-
71
-
72
-
73
-
74
-
75
-
76
-
77
-
78
-
79
-
80
-
81
-
82
-
83
-
84
-
85
-
86
-
87
-
88
-
89
-
90
-
91
-
92
-
93
-
94
-
95
-
96
-
97
-
98
-
 99
99 -
 100
100 -
 101
101 -
 102
102 -
 103
103 -
 104
104 -
 105
105 -
 106
106 -
 107
107 -
 108
108 -
 109
109 -
 110
110 -
 111
111 -
 112
112 -
 113
113 -
 114
114 -
 115
115 -
 116
116 -
 117
117 -
 118
118 -
 119
119 -
120
-
121
-
122
-
123
-
124
-
125
-
126
-
127
-
128
-
129
-
130
-
131
-
132
-
133
-
134
-
135
-
136
-
137
-
138
-
139
-
140
-
141
-
142
-
143
-
144
-
145
-
146
-
147
-
148
-
149
-
150
-
151
-
152
-
153
-
154
-
155
-
156
-
157
-
158
-
159
-
160
-
161
-
162
-
163
-
164
-
165
-
166
-
167
-
168
-
169
-
170
-
171
-
172
-
173
-
174
-
175
-
176
-
177
-
178
-
179
-
180
-
181
-
182
-
183
-
184
-
185
-
186
-
187
-
188
-
189
-
190
-
191
-
192
-
193
-
194
-
195
-
196
-
197
-
198
-
199
-
200
 |
 |

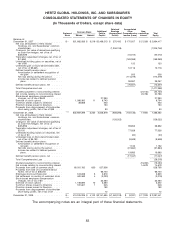
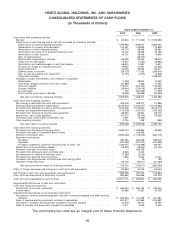
HERTZ GLOBAL HOLDINGS, INC. AND SUBSIDIARIES
CONSOLIDATED STATEMENTS OF CASH FLOWS
(In Thousands of Dollars)
Years ended December 31,
2010 2009 2008
Cash flows from operating activities:
Net loss .................................................. $ (30,661) $ (111,343) $ (1,185,960)
Adjustments to reconcile net loss to net cash provided by operating activities:
Depreciation of revenue earning equipment ............................ 1,789,903 1,849,674 2,085,665
Depreciation of property and equipment .............................. 154,031 159,693 172,848
Amortization of other intangible assets ............................... 64,713 66,059 66,282
Amortization and write-off of deferred financing costs ....................... 73,120 58,849 70,193
Amortization of debt discount .................................... 40,701 38,458 17,908
Gain on debt buyback ........................................ — (48,472) —
Stock-based compensation charges ................................. 36,560 35,464 28,023
(Gain) loss on derivatives ....................................... 10,810 (1,552) 22,938
Amortization and ineffectiveness of cash flow hedges ...................... 68,815 74,597 11,807
Provision for losses on doubtful accounts ............................. 19,667 27,951 31,068
Asset writedowns ........................................... 20,448 36,063 93,211
Deferred taxes on income ...................................... (26,123) 111,233 (234,810)
Gain on sale of property and equipment .............................. (5,740) (1,072) (9,602)
Impairment charges .......................................... — — 1,168,900
Changes in assets and liabilities, net of effects of acquisition:
Receivables ............................................... (7,459) 38,634 47,063
Inventories, prepaid expenses and other assets .......................... (61,886) 7,538 17,956
Accounts payable ........................................... 118,011 (227,479) 108,530
Accrued liabilities ........................................... (53,445) (179,416) (54,462)
Accrued taxes ............................................. 272 (207,029) (1,801)
Public liability and property damage ................................ (3,058) (34,536) (20,068)
Net cash provided by operating activities ............................ 2,208,679 1,693,314 2,435,689
Cash flows from investing activities:
Net change in restricted cash and cash equivalents ......................... 160,516 368,721 (71,836)
Revenue earning equipment expenditures .............................. (8,440,872) (7,527,317) (10,150,982)
Proceeds from disposal of revenue earning equipment ....................... 7,518,446 6,106,624 8,619,715
Property and equipment expenditures ................................. (179,209) (100,701) (193,766)
Proceeds from disposal of property and equipment ......................... 38,905 23,697 68,515
Acquisitions, net of cash acquired ................................... (47,571) (76,419) (70,920)
(Purchase) sale of short-term investments, net ............................ 3,491 (3,492) —
Other investing activities ......................................... 2,726 828 (488)
Net cash used in investing activities ............................... (943,568) (1,208,059) (1,799,762)
Cash flows from financing activities:
Proceeds from issuance of long-term debt .............................. 2,635,713 1,200,896 22,565
Proceeds from sale of Convertible Senior Notes ........................... — 459,483 —
Payment of long-term debt ....................................... (2,954,233) (1,149,876) (860,515)
Short-term borrowings:
Proceeds ................................................ 490,490 364,065 396,679
Payments ................................................ (970,949) (351,773) (374,333)
Proceeds (payments) under the revolving lines of credit, net .................. 1,026,070 (1,126,099) 198,761
Distributions to noncontrolling interest ................................. (18,200) (15,050) (24,150)
Proceeds from sale of common stock ................................. — 528,758 —
Proceeds from employee stock purchase plan ............................ 3,208 2,400 —
Net settlement on vesting of restricted stock ............................. (7,836) (2,219) —
Proceeds from exercise of stock options ............................... 7,635 5,342 6,754
Proceeds from disgorgement of stockholder short-swing profits .................. 7 19 138
Payment of financing costs ....................................... (78,151) (45,017) (61,223)
Net cash provided by (used in) financing activities ....................... 133,754 (129,071) (695,324)
Effect of foreign exchange rate changes on cash and cash equivalents ............... (10,337) 35,192 (76,540)
Net change in cash and cash equivalents during the period ..................... 1,388,528 391,376 (135,937)
Cash and cash equivalents at beginning of period ........................... 985,642 594,266 730,203
Cash and cash equivalents at end of period .............................. $2,374,170 $ 985,642 $ 594,266
Supplemental disclosures of cash flow information:
Cash paid during the period for:
Interest (net of amounts capitalized) .................................. $ 533,044 $ 635,153 $ 763,953
Income taxes ............................................... 50,688 31,321 33,408
Supplemental disclosures of non-cash flow information:
Purchases of revenue earning equipment included in accounts payable and other accrued
liabilities ................................................. $ 266,354 $ 141,039 $ 347,581
Sales of revenue earning equipment included in receivables .................... 504,217 537,862 1,025,832
Purchases of property and equipment included in accounts payable ............... 37,379 38,210 19,490
Sales of property and equipment included in receivables ...................... 11,071 5,229 2,452
The accompanying notes are an integral part of these financial statements.
85