Hertz 2010 Annual Report Download - page 80
Download and view the complete annual report
Please find page 80 of the 2010 Hertz annual report below. You can navigate through the pages in the report by either clicking on the pages listed below, or by using the keyword search tool below to find specific information within the annual report.-
 1
1 -
2
-
3
-
4
-
5
-
6
-
7
-
8
-
9
-
10
-
11
-
12
-
13
-
14
-
15
-
16
-
17
-
18
-
19
-
20
-
21
-
22
-
23
-
24
-
25
-
26
-
27
-
28
-
29
-
30
-
31
-
32
-
33
-
34
-
35
-
36
-
37
-
38
-
39
-
40
-
41
-
42
-
43
-
44
-
45
-
46
-
47
-
48
-
49
-
50
-
51
-
52
-
53
-
54
-
55
-
56
-
57
-
58
-
59
-
60
-
61
-
62
-
63
-
64
-
65
-
66
-
67
-
68
-
69
-
 70
70 -
 71
71 -
 72
72 -
 73
73 -
 74
74 -
 75
75 -
 76
76 -
 77
77 -
 78
78 -
 79
79 -
 80
80 -
 81
81 -
 82
82 -
 83
83 -
 84
84 -
 85
85 -
 86
86 -
 87
87 -
 88
88 -
 89
89 -
 90
90 -
91
-
92
-
93
-
94
-
95
-
96
-
97
-
98
-
99
-
100
-
101
-
102
-
103
-
104
-
105
-
106
-
107
-
108
-
109
-
110
-
111
-
112
-
113
-
114
-
115
-
116
-
117
-
118
-
119
-
120
-
121
-
122
-
123
-
124
-
125
-
126
-
127
-
128
-
129
-
130
-
131
-
132
-
133
-
134
-
135
-
136
-
137
-
138
-
139
-
140
-
141
-
142
-
143
-
144
-
145
-
146
-
147
-
148
-
149
-
150
-
151
-
152
-
153
-
154
-
155
-
156
-
157
-
158
-
159
-
160
-
161
-
162
-
163
-
164
-
165
-
166
-
167
-
168
-
169
-
170
-
171
-
172
-
173
-
174
-
175
-
176
-
177
-
178
-
179
-
180
-
181
-
182
-
183
-
184
-
185
-
186
-
187
-
188
-
189
-
190
-
191
-
192
-
193
-
194
-
195
-
196
-
197
-
198
-
199
-
200
 |
 |

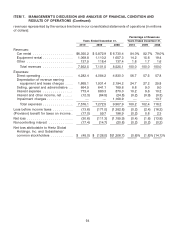
ITEM 7. MANAGEMENT’S DISCUSSION AND ANALYSIS OF FINANCIAL CONDITION AND
RESULTS OF OPERATIONS (Continued)
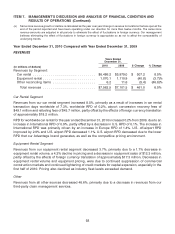
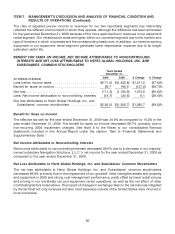
revenue to our rental rate revenue and rental rate revenue per transaction day (based on December 31, 2009 foreign
exchange rates) for the years ended December 31, 2010, 2009 and 2008 (in millions of dollars, except as noted):
Years Ended December 31,
2010 2009 2008
Car rental segment revenues ............................... $6,486.2 $ 5,979.0 $ 6,858.2
Non-rental rate revenue .................................. (1,043.5) (905.2) (1,080.6)
Foreign currency adjustment ............................... 121.5 99.9 (75.7)
Rental rate revenue ..................................... $5,564.2 $ 5,173.7 $ 5,701.9
Transaction days (in thousands) ............................. 127,159 118,459 128,693
Rental rate revenue per transaction day (in whole dollars) ............ $ 43.76 $ 43.68 $ 44.31
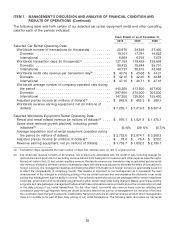
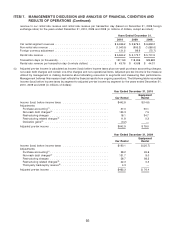
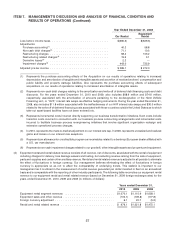
(c) Adjusted pre-tax income is calculated as income (loss) before income taxes plus non-cash purchase accounting charges,
non-cash debt charges and certain one-time charges and non-operational items. Adjusted pre-tax income is the measure
utilized by management in making decisions about allocating resources to segments and measuring their performance.
Management believes this measure best reflects the financial results from ongoing operations. The following table reconciles
income (loss) before income taxes by segment to adjusted pre-tax income by segment for the years ended December 31,
2010, 2009 and 2008 (in millions of dollars):
Year Ended December 31, 2010
Equipment
Car Rental Rental
Income (loss) before income taxes ......................... $442.8 $(14.6)
Adjustments:
Purchase accounting(1) ................................ 37.0 50.1
Non-cash debt charges(2) .............................. 133.3 7.5
Restructuring charges ................................ 18.1 34.7
Restructuring related charges(3) .......................... 11.9 0.3
Derivative gains(4) ................................... (0.2) —
Adjusted pre-tax income ................................ $642.9 $ 78.0
Year Ended December 31, 2009
Equipment
Car Rental Rental
Income (loss) before income taxes ......................... $190.1 $ (20.7)
Adjustments:
Purchase accounting(1) ................................ 38.2 49.6
Non-cash debt charges(2) .............................. 131.7 9.0
Restructuring charges ................................ 58.7 38.2
Restructuring related charges(3) .......................... 42.3 0.3
Third-party bankruptcy reserve(5) .......................... 4.3 —
Adjusted pre-tax income ................................ $465.3 $ 76.4
56