Hertz 2008 Annual Report Download - page 99
Download and view the complete annual report
Please find page 99 of the 2008 Hertz annual report below. You can navigate through the pages in the report by either clicking on the pages listed below, or by using the keyword search tool below to find specific information within the annual report.-
 1
1 -
2
-
3
-
4
-
5
-
6
-
7
-
8
-
9
-
10
-
11
-
12
-
13
-
14
-
15
-
16
-
17
-
18
-
19
-
20
-
21
-
22
-
23
-
24
-
25
-
26
-
27
-
28
-
29
-
30
-
31
-
32
-
33
-
34
-
35
-
36
-
37
-
38
-
39
-
40
-
41
-
42
-
43
-
44
-
45
-
46
-
47
-
48
-
49
-
50
-
51
-
52
-
53
-
54
-
55
-
56
-
57
-
58
-
59
-
60
-
61
-
62
-
63
-
64
-
65
-
66
-
67
-
68
-
69
-
70
-
71
-
72
-
73
-
74
-
75
-
76
-
77
-
78
-
79
-
80
-
81
-
82
-
83
-
84
-
85
-
86
-
87
-
88
-
 89
89 -
 90
90 -
 91
91 -
 92
92 -
 93
93 -
 94
94 -
 95
95 -
 96
96 -
 97
97 -
 98
98 -
 99
99 -
 100
100 -
 101
101 -
 102
102 -
 103
103 -
 104
104 -
 105
105 -
 106
106 -
 107
107 -
 108
108 -
 109
109 -
110
-
111
-
112
-
113
-
114
-
115
-
116
-
117
-
118
-
119
-
120
-
121
-
122
-
123
-
124
-
125
-
126
-
127
-
128
-
129
-
130
-
131
-
132
-
133
-
134
-
135
-
136
-
137
-
138
-
139
-
140
-
141
-
142
-
143
-
144
-
145
-
146
-
147
-
148
-
149
-
150
-
151
-
152
-
153
-
154
-
155
-
156
-
157
-
158
-
159
-
160
-
161
-
162
-
163
-
164
-
165
-
166
-
167
-
168
-
169
-
170
-
171
-
172
-
173
-
174
-
175
-
176
-
177
-
178
-
179
-
180
-
181
-
182
-
183
-
184
-
185
-
186
-
187
-
188
-
189
-
190
-
191
-
192
-
193
-
194
-
195
-
196
-
197
-
198
-
199
-
200
-
201
-
202
-
203
-
204
-
205
-
206
-
207
-
208
-
209
-
210
-
211
-
212
-
213
-
214
-
215
-
216
-
217
-
218
-
219
-
220
-
221
-
222
-
223
-
224
-
225
-
226
-
227
-
228
-
229
-
230
-
231
-
232
-
233
-
234
-
235
-
236
-
237
-
238
-
239
-
240
-
241
-
242
-
243
-
244
-
245
-
246
-
247
-
248
-
249
-
250
-
251
-
252
 |
 |

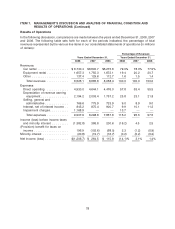
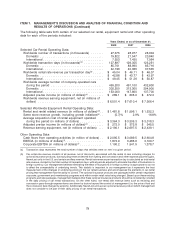
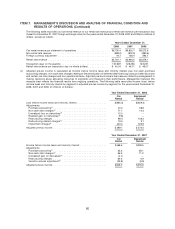
ITEM 7. MANAGEMENT’S DISCUSSION AND ANALYSIS OF FINANCIAL CONDITION AND
RESULTS OF OPERATIONS (Continued)
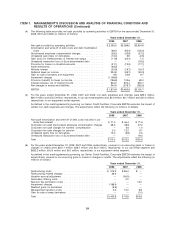
The following table sets forth certain of our selected car rental, equipment rental and other operating
data for each of the periods indicated:
Years Ended, or as of December 31,
2008 2007 2006
Selected Car Rental Operating Data:
Worldwide number of transactions (in thousands) ....... 27,375 28,977 28,004
Domestic ................................... 19,822 21,547 20,940
International ................................. 7,553 7,430 7,064
Worldwide transaction days (in thousands)(a) ........... 127,897 129,355 123,251
Domestic ................................... 85,701 88,990 85,716
International ................................. 42,196 40,365 37,535
Worldwide rental rate revenue per transaction day(b) ...... $ 45.04 $ 46.11 $ 46.07
Domestic ................................... $ 42.88 $ 43.77 $ 43.97
International ................................. $ 49.45 $ 51.26 $ 50.87
Worldwide average number of company-operated cars
during the period ............................. 455,200 461,100 432,600
Domestic ................................... 302,200 313,300 294,900
International ................................. 153,000 147,800 137,700
Adjusted pre-tax income (in millions of dollars)(c) ........ $ 289.1 $ 605.0 $ 472.3
Worldwide revenue earning equipment, net (in millions of
dollars) .................................... $6,501.4 $ 7,610.4 $ 7,366.4
Selected Worldwide Equipment Rental Operating Data:
Rental and rental related revenue (in millions of dollars)(d) . . $ 1,481.8 $ 1,596.1 $ 1,532.3
Same store revenue growth, including growth initiatives(e) . . (5.7)% 2.9% 16.8%
Average acquisition cost of rental equipment operated
during the period (in millions of dollars) ............. $3,364.3 $ 3,305.3 $ 3,018.3
Adjusted pre-tax income (in millions of dollars)(c) ........ $ 272.0 $ 373.8 $ 345.5
Revenue earning equipment, net (in millions of dollars) . . . $ 2,190.1 $ 2,697.5 $ 2,439.1
Other Operating Data:
Cash flows from operating activities (in million of dollars) . . $ 2,095.5 $ 3,089.5 $ 2,604.8
EBITDA (in millions of dollars)(f) ..................... 1,874.9 3,485.6 3,100.7
Corporate EBITDA (in millions of dollars)(f) ............. 1,100.2 1,541.5 1,378.7
(a) Transaction days represents the total number of days that vehicles were on rent in a given period.
(b) Car rental rate revenue consists of all revenue, net of discounts, associated with the rental of cars including charges for
optional insurance products, but excluding revenue derived from fueling and concession and other expense pass-throughs,
NeverLost units in the U.S. and certain ancillary revenue. Rental rate revenue per transaction day is calculated as total rental
rate revenue, divided by the total number of transaction days, with all periods adjusted to eliminate the effect of fluctuations in
foreign currency. Our management believes eliminating the effect of fluctuations in foreign currency is appropriate so as not
to affect the comparability of underlying trends. This statistic is important to our management as it represents the best
measurement of the changes in underlying pricing in the car rental business and encompasses the elements in car rental
pricing that management has the ability to control. The optional insurance products are packaged within certain negotiated
corporate, government and membership programs and within certain retail rates being charged. Based upon these existing
programs and rate packages, management believes that these optional insurance products should be consistently included
in the daily pricing of car rental transactions. On the other hand, non-rental rate revenue items such as refueling and
concession pass-through expense items are driven by factors beyond the control of management (i.e. the price of fuel and
the concession fees charged by airports). Additionally, NeverLost units are an optional revenue product which management
does not consider to be part of their daily pricing of car rental transactions.
79