Hertz 2008 Annual Report Download - page 180
Download and view the complete annual report
Please find page 180 of the 2008 Hertz annual report below. You can navigate through the pages in the report by either clicking on the pages listed below, or by using the keyword search tool below to find specific information within the annual report.-
 1
1 -
2
-
3
-
4
-
5
-
6
-
7
-
8
-
9
-
10
-
11
-
12
-
13
-
14
-
15
-
16
-
17
-
18
-
19
-
20
-
21
-
22
-
23
-
24
-
25
-
26
-
27
-
28
-
29
-
30
-
31
-
32
-
33
-
34
-
35
-
36
-
37
-
38
-
39
-
40
-
41
-
42
-
43
-
44
-
45
-
46
-
47
-
48
-
49
-
50
-
51
-
52
-
53
-
54
-
55
-
56
-
57
-
58
-
59
-
60
-
61
-
62
-
63
-
64
-
65
-
66
-
67
-
68
-
69
-
70
-
71
-
72
-
73
-
74
-
75
-
76
-
77
-
78
-
79
-
80
-
81
-
82
-
83
-
84
-
85
-
86
-
87
-
88
-
89
-
90
-
91
-
92
-
93
-
94
-
95
-
96
-
97
-
98
-
99
-
100
-
101
-
102
-
103
-
104
-
105
-
106
-
107
-
108
-
109
-
110
-
111
-
112
-
113
-
114
-
115
-
116
-
117
-
118
-
119
-
120
-
121
-
122
-
123
-
124
-
125
-
126
-
127
-
128
-
129
-
130
-
131
-
132
-
133
-
134
-
135
-
136
-
137
-
138
-
139
-
140
-
141
-
142
-
143
-
144
-
145
-
146
-
147
-
148
-
149
-
150
-
151
-
152
-
153
-
154
-
155
-
156
-
157
-
158
-
159
-
160
-
161
-
162
-
163
-
164
-
165
-
166
-
167
-
168
-
169
-
 170
170 -
 171
171 -
 172
172 -
 173
173 -
 174
174 -
 175
175 -
 176
176 -
 177
177 -
 178
178 -
 179
179 -
 180
180 -
 181
181 -
 182
182 -
 183
183 -
 184
184 -
 185
185 -
 186
186 -
 187
187 -
 188
188 -
 189
189 -
 190
190 -
191
-
192
-
193
-
194
-
195
-
196
-
197
-
198
-
199
-
200
-
201
-
202
-
203
-
204
-
205
-
206
-
207
-
208
-
209
-
210
-
211
-
212
-
213
-
214
-
215
-
216
-
217
-
218
-
219
-
220
-
221
-
222
-
223
-
224
-
225
-
226
-
227
-
228
-
229
-
230
-
231
-
232
-
233
-
234
-
235
-
236
-
237
-
238
-
239
-
240
-
241
-
242
-
243
-
244
-
245
-
246
-
247
-
248
-
249
-
250
-
251
-
252
 |
 |

HERTZ GLOBAL HOLDINGS, INC. AND SUBSIDIARIES
NOTES TO CONSOLIDATED FINANCIAL STATEMENTS (Continued)
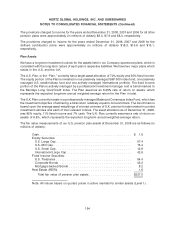
In November, 2008 we granted 525,000 Restricted Stock Units, or ‘‘RSUs,’’ to key executives and
employees at a fair value of $5.04 and 760,000 Performance Stock Units, or ‘‘PSUs,’’ at fair values
ranging from $4.70 to $5.04 including a grant of 215,000 PSUs to Mr. Frissora. RSUs granted in 2008
generally have the terms set forth in the Omnibus Plan, however in the event of an employee’s death or
disability (as defined in the Omnibus Plan), a pro rata portion of the RSUs that would have vested on the
next anniversary of the grant date will vest and the remainder of the RSUs will be canceled.
Compensation expense for RSUs and PSUs is based on the grant date fair value, and is recognized
ratably over the two year vesting period. The PSUs have an additional vesting condition. Half of each
award of PSUs will vest on the first anniversary of the grant date if the consolidated leverage ratio
covenants within our Senior Credit Facilities have not been violated during that twelve month period.
Assuming the first half of the grant vests, the second half will vest on the second anniversary of the grant
date. If the consolidated leverage ratio covenant is violated during the first twelve months, all PSUs will
be forfeited.
For the year ended December 31, 2008, we recognized compensation cost of approximately $0.4 million
($0.2 million, net of tax) for RSUs and PSUs.
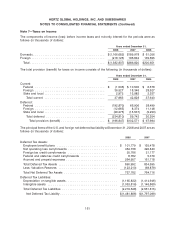
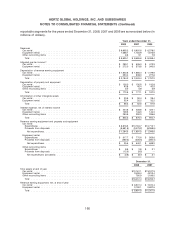
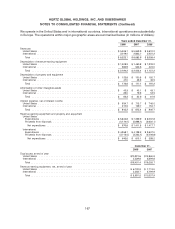
Note 6—Depreciation of Revenue Earning Equipment
Depreciation of revenue earning equipment includes the following (in thousands of dollars):
Years ended December 31,
2008 2007 2006
Depreciation of revenue earning equipment ............ $2,020,300 $1,905,846 $1,761,804
Adjustment of depreciation upon disposal of the equipment 83,115 21,185 (35,857)
Rents paid for vehicles leased ..................... 90,749 76,329 31,255
Total ...................................... $2,194,164 $2,003,360 $1,757,202
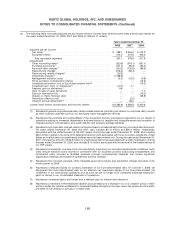
The adjustment of depreciation upon disposal of revenue earning equipment for the years ended
December 31, 2008, 2007 and 2006 included (in millions of dollars) a net loss of $32.1 and net gains of
$0.6 and $16.3, respectively, on the disposal of industrial and construction equipment used in our
equipment rental operations, and net losses of $51.0, $21.8 and net gains of $19.6, respectively, on the
disposal of vehicles used in our car rental operations.
Depreciation rates are reviewed on an ongoing basis based on management’s routine review of present
and estimated future market conditions and their effect on residual values at the time of disposal. During
2008, 2007 and 2006, depreciation rates being used to compute the provision for depreciation of
revenue earning equipment were adjusted on certain vehicles in our car rental operations to reflect
changes in the estimated residual values to be realized when revenue earning equipment is sold. These
depreciation rate changes resulted in net increases of $36.6 million, $13.7 million and $5.3 million in
depreciation expense for the years ended December 31, 2008, 2007 and 2006, respectively. During
2008, 2007 and 2006, depreciation rates in certain of our equipment rental operations were decreased
and resulted in net decreases of $3.9 million, $13.1 million and $18.4 million in depreciation expense for
the years ended December 31, 2008 and 2007, respectively.
For the years ended December 31, 2008, 2007 and 2006, our worldwide car rental operations sold
approximately 189,700, 163,700 and 101,000 non-program cars, respectively, a 15.9% increase in 2008
versus 2007.
160