Hertz 2008 Annual Report Download - page 130
Download and view the complete annual report
Please find page 130 of the 2008 Hertz annual report below. You can navigate through the pages in the report by either clicking on the pages listed below, or by using the keyword search tool below to find specific information within the annual report.-
 1
1 -
2
-
3
-
4
-
5
-
6
-
7
-
8
-
9
-
10
-
11
-
12
-
13
-
14
-
15
-
16
-
17
-
18
-
19
-
20
-
21
-
22
-
23
-
24
-
25
-
26
-
27
-
28
-
29
-
30
-
31
-
32
-
33
-
34
-
35
-
36
-
37
-
38
-
39
-
40
-
41
-
42
-
43
-
44
-
45
-
46
-
47
-
48
-
49
-
50
-
51
-
52
-
53
-
54
-
55
-
56
-
57
-
58
-
59
-
60
-
61
-
62
-
63
-
64
-
65
-
66
-
67
-
68
-
69
-
70
-
71
-
72
-
73
-
74
-
75
-
76
-
77
-
78
-
79
-
80
-
81
-
82
-
83
-
84
-
85
-
86
-
87
-
88
-
89
-
90
-
91
-
92
-
93
-
94
-
95
-
96
-
97
-
98
-
99
-
100
-
101
-
102
-
103
-
104
-
105
-
106
-
107
-
108
-
109
-
110
-
111
-
112
-
113
-
114
-
115
-
116
-
117
-
118
-
119
-
 120
120 -
 121
121 -
 122
122 -
 123
123 -
 124
124 -
 125
125 -
 126
126 -
 127
127 -
 128
128 -
 129
129 -
 130
130 -
 131
131 -
 132
132 -
 133
133 -
 134
134 -
 135
135 -
 136
136 -
 137
137 -
 138
138 -
 139
139 -
 140
140 -
141
-
142
-
143
-
144
-
145
-
146
-
147
-
148
-
149
-
150
-
151
-
152
-
153
-
154
-
155
-
156
-
157
-
158
-
159
-
160
-
161
-
162
-
163
-
164
-
165
-
166
-
167
-
168
-
169
-
170
-
171
-
172
-
173
-
174
-
175
-
176
-
177
-
178
-
179
-
180
-
181
-
182
-
183
-
184
-
185
-
186
-
187
-
188
-
189
-
190
-
191
-
192
-
193
-
194
-
195
-
196
-
197
-
198
-
199
-
200
-
201
-
202
-
203
-
204
-
205
-
206
-
207
-
208
-
209
-
210
-
211
-
212
-
213
-
214
-
215
-
216
-
217
-
218
-
219
-
220
-
221
-
222
-
223
-
224
-
225
-
226
-
227
-
228
-
229
-
230
-
231
-
232
-
233
-
234
-
235
-
236
-
237
-
238
-
239
-
240
-
241
-
242
-
243
-
244
-
245
-
246
-
247
-
248
-
249
-
250
-
251
-
252
 |
 |

ITEM 7. MANAGEMENT’S DISCUSSION AND ANALYSIS OF FINANCIAL CONDITION AND
RESULTS OF OPERATIONS (Continued)
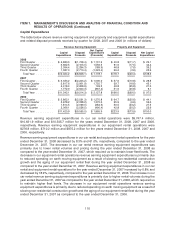
Capital Expenditures
The table below shows revenue earning equipment and property and equipment capital expenditures
and related disposal proceeds received by quarter for 2008, 2007 and 2006 (in millions of dollars):
Revenue Earning Equipment Property and Equipment
Net Capital
Capital Disposal Expenditures Capital Disposal Net Capital
Expenditures Proceeds (Proceeds) Expenditures Proceeds Expenditures
2008
First Quarter .......... $ 2,880.3 $(1,748.4) $ 1,131.9 $ 40.8 $(11.7) $ 29.1
Second Quarter ....... 3,662.5 (2,103.0) 1,559.5 61.9 (17.5) 44.4
Third Quarter ......... 2,094.4 (2,284.3) (189.9) 46.8 (7.6) 39.2
Fourth Quarter ........ 1,387.0 (2,710.4) (1,323.4) 29.2 (3.6) 25.6
Total Year .......... $10,024.2 $(8,846.1) $ 1,178.1 $178.7 $(40.4) $138.3
2007
First Quarter .......... $ 3,333.2 $(2,243.2) $ 1,090.0 $ 37.6 $(10.8) $ 26.8
Second Quarter ....... 3,817.6 (2,061.9) 1,755.7 59.7 (16.6) 43.1
Third Quarter ......... 2,418.4 (2,268.9) 149.5 46.8 (25.8) 21.0
Fourth Quarter ........ 1,772.9 (2,640.3) (867.4) 51.9 (45.8) 6.1
Total Year .......... $11,342.1 $(9,214.3) $ 2,127.8 $196.0 $(99.0) $ 97.0
2006
First Quarter .......... $ 3,862.1 $(2,591.3) $ 1,270.8 $ 64.7 $(20.6) $ 44.1
Second Quarter ....... 3,678.2 (2,308.2) 1,370.0 65.9 (9.9) 56.0
Third Quarter ......... 1,814.5 (2,099.0) (284.5) 50.5 (23.2) 27.3
Fourth Quarter ........ 2,066.1 (2,556.5) (490.4) 42.8 (20.2) 22.6
Total Year .......... $11,420.9 $(9,555.0) $ 1,865.9 $223.9 $(73.9) $150.0
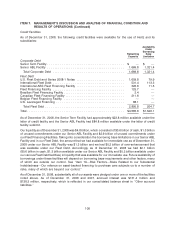
Revenue earning equipment expenditures in our car rental operations were $9,747.4 million,
$10,631.9 million and $10,545.7 million for the years ended December 31, 2008, 2007 and 2006,
respectively. Revenue earning equipment expenditures in our equipment rental operations were
$276.8 million, $710.2 million and $875.2 million for the years ended December 31, 2008, 2007 and
2006, respectively.
Revenue earning equipment expenditures in our car rental and equipment rental operations for the year
ended December 31, 2008 decreased by 8.3% and 61.0%, respectively, compared to the year ended
December 31, 2007. The decrease in our car rental revenue earning equipment expenditures was
primarily due to lower rental volumes and pricing during the year ended December 31, 2008 as
compared to the year ended December 31, 2007, which required us to maintain lower fleet levels. The
decrease in our equipment rental operations revenue earning equipment expenditures is primarily due
to reduced spending on earth moving equipment as a result of slowing non-residential construction
growth and the aging of our equipment rental fleet during the year ended December 31, 2008 as
compared to the year ended December 31, 2007. Revenue earning equipment expenditures in our car
rental and equipment rental operations for the year ended December 31, 2007 increased by 0.8% and
decreased by 18.9%, respectively, compared to the year ended December 31, 2006. The increase in our
car rental revenue earning equipment expenditures is primarily due to higher rental volumes during the
year ended December 31, 2007 as compared to the year ended December 31, 2006, which required us
to maintain higher fleet levels. The decrease in our equipment rental operations revenue earning
equipment expenditures is primarily due to reduced spending on earth moving equipment as a result of
slowing non-residential construction growth and the aging of our equipment rental fleet during the year
ended December 31, 2007 as compared to the year ended December 31, 2006.
110