Hertz 2008 Annual Report Download - page 87
Download and view the complete annual report
Please find page 87 of the 2008 Hertz annual report below. You can navigate through the pages in the report by either clicking on the pages listed below, or by using the keyword search tool below to find specific information within the annual report.-
 1
1 -
2
-
3
-
4
-
5
-
6
-
7
-
8
-
9
-
10
-
11
-
12
-
13
-
14
-
15
-
16
-
17
-
18
-
19
-
20
-
21
-
22
-
23
-
24
-
25
-
26
-
27
-
28
-
29
-
30
-
31
-
32
-
33
-
34
-
35
-
36
-
37
-
38
-
39
-
40
-
41
-
42
-
43
-
44
-
45
-
46
-
47
-
48
-
49
-
50
-
51
-
52
-
53
-
54
-
55
-
56
-
57
-
58
-
59
-
60
-
61
-
62
-
63
-
64
-
65
-
66
-
67
-
68
-
69
-
70
-
71
-
72
-
73
-
74
-
75
-
76
-
 77
77 -
 78
78 -
 79
79 -
 80
80 -
 81
81 -
 82
82 -
 83
83 -
 84
84 -
 85
85 -
 86
86 -
 87
87 -
 88
88 -
 89
89 -
 90
90 -
 91
91 -
 92
92 -
 93
93 -
 94
94 -
 95
95 -
 96
96 -
 97
97 -
98
-
99
-
100
-
101
-
102
-
103
-
104
-
105
-
106
-
107
-
108
-
109
-
110
-
111
-
112
-
113
-
114
-
115
-
116
-
117
-
118
-
119
-
120
-
121
-
122
-
123
-
124
-
125
-
126
-
127
-
128
-
129
-
130
-
131
-
132
-
133
-
134
-
135
-
136
-
137
-
138
-
139
-
140
-
141
-
142
-
143
-
144
-
145
-
146
-
147
-
148
-
149
-
150
-
151
-
152
-
153
-
154
-
155
-
156
-
157
-
158
-
159
-
160
-
161
-
162
-
163
-
164
-
165
-
166
-
167
-
168
-
169
-
170
-
171
-
172
-
173
-
174
-
175
-
176
-
177
-
178
-
179
-
180
-
181
-
182
-
183
-
184
-
185
-
186
-
187
-
188
-
189
-
190
-
191
-
192
-
193
-
194
-
195
-
196
-
197
-
198
-
199
-
200
-
201
-
202
-
203
-
204
-
205
-
206
-
207
-
208
-
209
-
210
-
211
-
212
-
213
-
214
-
215
-
216
-
217
-
218
-
219
-
220
-
221
-
222
-
223
-
224
-
225
-
226
-
227
-
228
-
229
-
230
-
231
-
232
-
233
-
234
-
235
-
236
-
237
-
238
-
239
-
240
-
241
-
242
-
243
-
244
-
245
-
246
-
247
-
248
-
249
-
250
-
251
-
252
 |
 |

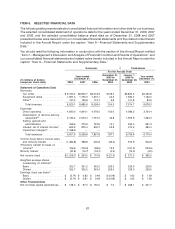
ITEM 6. SELECTED FINANCIAL DATA
The following table presents selected consolidated financial information and other data for our business.
The selected consolidated statement of operations data for the years ended December 31, 2008, 2007
and 2006, and the selected consolidated balance sheet data as of December 31, 2008 and 2007
presented below were derived from our consolidated financial statements and the related notes thereto
included in this Annual Report under the caption ‘‘Item 8—Financial Statements and Supplementary
Data.’’
You should read the following information in conjunction with the section of this Annual Report entitled
‘‘Item 7—Management’s Discussion and Analysis of Financial Condition and Results of Operations’’ and
our consolidated financial statements and related notes thereto included in this Annual Report under the
caption ‘‘Item 8—Financial Statements and Supplementary Data.’’
Successor Predecessor
For the Periods From
December 21, January 1,
Years ended Year ended
2005 to 2005 to
December 31, December 31,
(In millions of dollars, December 31, December 20,
except per share data) 2008 2007 2006 2005 2005 2004
Statement of Operations Data
Revenues:
Car rental ................. $6,730.4 $6,800.7 $6,273.6 $129.4 $5,820.5 $5,430.8
Equipment rental ............ 1,657.3 1,755.3 1,672.1 22.5 1,392.4 1,162.0
Other(a) .................. 137.4 129.6 112.7 2.6 101.8 83.2
Total revenues ............ 8,525.1 8,685.6 8,058.4 154.5 7,314.7 6,676.0
Expenses:
Direct operating ............. 4,930.0 4,644.1 4,476.0 103.0 4,086.3 3,734.4
Depreciation of revenue earning
equipment(b) .............. 2,194.2 2,003.4 1,757.2 43.8 1,555.9 1,463.3
Selling, general and
administrative ............. 769.6 775.9 723.9 15.1 623.4 591.3
Interest, net of interest income(c) . . 845.2 875.4 900.7 25.8 474.2 384.4
Impairment charges(d) ......... 1,168.9 — — — — —
Total expenses ............ 9,907.9 8,298.8 7,857.8 187.7 6,739.8 6,173.4
Income (loss) before income taxes
and minority interest .......... (1,382.8) 386.8 200.6 (33.2) 574.9 502.6
(Provision) benefit for taxes on
income(e) ................. 196.9 (102.6) (68.0) 12.2 (191.3) (133.9)
Minority interest .............. (20.8) (19.7) (16.7) (0.3) (12.3) (3.2)
Net income (loss) ............. $(1,206.7) $ 264.5 $ 115.9 $ (21.3) $ 371.3 $ 365.5
Weighted average shares
outstanding (in millions)(f)
Basic .................... 322.7 321.2 242.5 229.5 229.5 229.5
Diluted ................... 322.7 325.5 243.4 229.5 229.5 229.5
Earnings (loss) per share(f)
Basic .................... $ (3.74) $ 0.82 $ 0.48 $ (0.09) $ 1.62 $ 1.59
Diluted ................... $ (3.74) $ 0.81 $ 0.48 $ (0.09) $ 1.62 $ 1.59
Other Financial Data
Net non-fleet capital expenditures . . . $ 138.3 $ 97.0 $ 150.0 $ 7.0 $ 258.1 $ 221.7
67