Hertz 2008 Annual Report Download - page 105
Download and view the complete annual report
Please find page 105 of the 2008 Hertz annual report below. You can navigate through the pages in the report by either clicking on the pages listed below, or by using the keyword search tool below to find specific information within the annual report.-
 1
1 -
2
-
3
-
4
-
5
-
6
-
7
-
8
-
9
-
10
-
11
-
12
-
13
-
14
-
15
-
16
-
17
-
18
-
19
-
20
-
21
-
22
-
23
-
24
-
25
-
26
-
27
-
28
-
29
-
30
-
31
-
32
-
33
-
34
-
35
-
36
-
37
-
38
-
39
-
40
-
41
-
42
-
43
-
44
-
45
-
46
-
47
-
48
-
49
-
50
-
51
-
52
-
53
-
54
-
55
-
56
-
57
-
58
-
59
-
60
-
61
-
62
-
63
-
64
-
65
-
66
-
67
-
68
-
69
-
70
-
71
-
72
-
73
-
74
-
75
-
76
-
77
-
78
-
79
-
80
-
81
-
82
-
83
-
84
-
85
-
86
-
87
-
88
-
89
-
90
-
91
-
92
-
93
-
94
-
 95
95 -
 96
96 -
 97
97 -
 98
98 -
 99
99 -
 100
100 -
 101
101 -
 102
102 -
 103
103 -
 104
104 -
 105
105 -
 106
106 -
 107
107 -
 108
108 -
 109
109 -
 110
110 -
 111
111 -
 112
112 -
 113
113 -
 114
114 -
 115
115 -
116
-
117
-
118
-
119
-
120
-
121
-
122
-
123
-
124
-
125
-
126
-
127
-
128
-
129
-
130
-
131
-
132
-
133
-
134
-
135
-
136
-
137
-
138
-
139
-
140
-
141
-
142
-
143
-
144
-
145
-
146
-
147
-
148
-
149
-
150
-
151
-
152
-
153
-
154
-
155
-
156
-
157
-
158
-
159
-
160
-
161
-
162
-
163
-
164
-
165
-
166
-
167
-
168
-
169
-
170
-
171
-
172
-
173
-
174
-
175
-
176
-
177
-
178
-
179
-
180
-
181
-
182
-
183
-
184
-
185
-
186
-
187
-
188
-
189
-
190
-
191
-
192
-
193
-
194
-
195
-
196
-
197
-
198
-
199
-
200
-
201
-
202
-
203
-
204
-
205
-
206
-
207
-
208
-
209
-
210
-
211
-
212
-
213
-
214
-
215
-
216
-
217
-
218
-
219
-
220
-
221
-
222
-
223
-
224
-
225
-
226
-
227
-
228
-
229
-
230
-
231
-
232
-
233
-
234
-
235
-
236
-
237
-
238
-
239
-
240
-
241
-
242
-
243
-
244
-
245
-
246
-
247
-
248
-
249
-
250
-
251
-
252
 |
 |

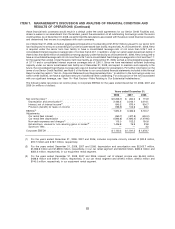
ITEM 7. MANAGEMENT’S DISCUSSION AND ANALYSIS OF FINANCIAL CONDITION AND
RESULTS OF OPERATIONS (Continued)
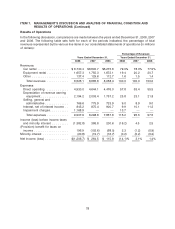
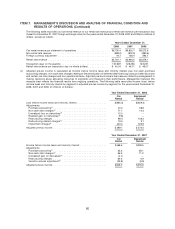
Year Ended December 31, 2008 Compared with Year Ended December 31, 2007
Revenues
Years Ended
December 31,
2008 2007 $ Change % Change
Revenues
Car rental .................................... $6,730.4 $6,800.7 $ (70.3) (1.0)%
Equipment rental ............................... 1,657.3 1,755.3 (98.0) (5.6)%
Other ....................................... 137.4 129.6 7.8 6.0%
Total revenues ............................... $8,525.1 $8,685.6 $(160.5) (1.8)%
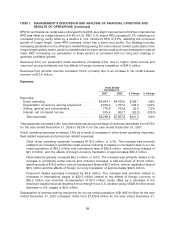
Total revenues decreased 1.8% for the year ended December 31, 2008 compared to the year ended
December 31, 2007.
Revenues from our car rental operations decreased 1.0%, primarily as a result of lower RPD described
below, a 1.1% decrease in car rental transaction days worldwide and a decrease in airport concession
recovery fees of $10.4 million, partly offset by the effects of foreign currency translation of approximately
$119.3 million and an increase in refueling fees of $31.9 million.
RPD for worldwide car rental for the year ended December 31, 2008 declined 2.3% from 2007, due to
declines in U.S. and International RPD of 2.0% and 3.5%, respectively. U.S. airport RPD decreased 1.9%
and U.S. off-airport RPD declined by 1.0%. Our strategy includes increasing penetration in the off-airport
market and growing the online leisure market, particularly in the longer length weekly sector, which is
characterized by lower vehicle costs and lower transaction costs at lower RPD. Increasing our
penetration in these sectors is consistent with our long term strategy to generate profitable growth.
Revenues from our equipment rental operations decreased 5.6%, primarily due to a 6.1% decrease in
equipment rental volume and a 1.4% decline in pricing, partly offset by the effects of foreign currency
translation of approximately $19.6 million.
Revenues from all other sources increased 6.0%, primarily due to increases in international car leasing
revenues of $4.6 million and car rental licensee revenues of $4.2 million, including the effects of foreign
currency translation of approximately $2.1 million.
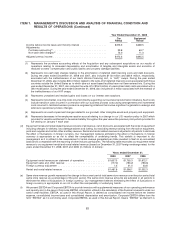
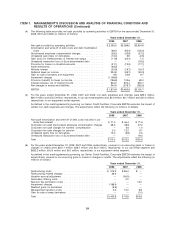
Expenses
Years Ended
December 31,
2008 2007 $ Change % Change
Expenses:
Direct operating ............................... $4,930.0 $4,644.1 $ 285.9 6.2%
Depreciation of revenue earning equipment ........... 2,194.2 2,003.4 190.8 9.5%
Selling, general and administrative .................. 769.6 775.9 (6.3) (0.8)%
Interest, net of interest income ..................... 845.2 875.4 (30.2) (3.5)%
Impairment charges ............................ 1,168.9 — 1,168.9 100.0%
Total expenses .............................. $9,907.9 $8,298.8 $1,609.1 19.4%
85