Hertz 2008 Annual Report Download - page 104
Download and view the complete annual report
Please find page 104 of the 2008 Hertz annual report below. You can navigate through the pages in the report by either clicking on the pages listed below, or by using the keyword search tool below to find specific information within the annual report.-
 1
1 -
2
-
3
-
4
-
5
-
6
-
7
-
8
-
9
-
10
-
11
-
12
-
13
-
14
-
15
-
16
-
17
-
18
-
19
-
20
-
21
-
22
-
23
-
24
-
25
-
26
-
27
-
28
-
29
-
30
-
31
-
32
-
33
-
34
-
35
-
36
-
37
-
38
-
39
-
40
-
41
-
42
-
43
-
44
-
45
-
46
-
47
-
48
-
49
-
50
-
51
-
52
-
53
-
54
-
55
-
56
-
57
-
58
-
59
-
60
-
61
-
62
-
63
-
64
-
65
-
66
-
67
-
68
-
69
-
70
-
71
-
72
-
73
-
74
-
75
-
76
-
77
-
78
-
79
-
80
-
81
-
82
-
83
-
84
-
85
-
86
-
87
-
88
-
89
-
90
-
91
-
92
-
93
-
 94
94 -
 95
95 -
 96
96 -
 97
97 -
 98
98 -
 99
99 -
 100
100 -
 101
101 -
 102
102 -
 103
103 -
 104
104 -
 105
105 -
 106
106 -
 107
107 -
 108
108 -
 109
109 -
 110
110 -
 111
111 -
 112
112 -
 113
113 -
 114
114 -
115
-
116
-
117
-
118
-
119
-
120
-
121
-
122
-
123
-
124
-
125
-
126
-
127
-
128
-
129
-
130
-
131
-
132
-
133
-
134
-
135
-
136
-
137
-
138
-
139
-
140
-
141
-
142
-
143
-
144
-
145
-
146
-
147
-
148
-
149
-
150
-
151
-
152
-
153
-
154
-
155
-
156
-
157
-
158
-
159
-
160
-
161
-
162
-
163
-
164
-
165
-
166
-
167
-
168
-
169
-
170
-
171
-
172
-
173
-
174
-
175
-
176
-
177
-
178
-
179
-
180
-
181
-
182
-
183
-
184
-
185
-
186
-
187
-
188
-
189
-
190
-
191
-
192
-
193
-
194
-
195
-
196
-
197
-
198
-
199
-
200
-
201
-
202
-
203
-
204
-
205
-
206
-
207
-
208
-
209
-
210
-
211
-
212
-
213
-
214
-
215
-
216
-
217
-
218
-
219
-
220
-
221
-
222
-
223
-
224
-
225
-
226
-
227
-
228
-
229
-
230
-
231
-
232
-
233
-
234
-
235
-
236
-
237
-
238
-
239
-
240
-
241
-
242
-
243
-
244
-
245
-
246
-
247
-
248
-
249
-
250
-
251
-
252
 |
 |

ITEM 7. MANAGEMENT’S DISCUSSION AND ANALYSIS OF FINANCIAL CONDITION AND
RESULTS OF OPERATIONS (Continued)
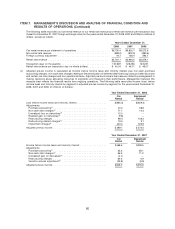
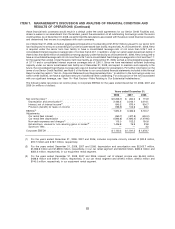
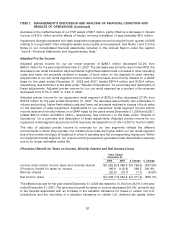
(4) The following table reconciles net cash provided by operating activities to EBITDA for the years ended December 31,
2008, 2007 and 2006 (in millions of dollars):
Years ended December 31,
2008 2007 2006
Net cash provided by operating activities ................. $2,095.5 $3,089.5 $2,604.8
Amortization and write-off of debt costs and debt modification
costs ...................................... (88.1) (85.3) (105.0)
Stock-based employee compensation charges ............. (28.0) (32.9) (27.2)
Unrealized gain (loss) on derivatives .................... (12.0) 3.9 (2.5)
Gain (loss) on ineffectiveness of interest rate swaps .......... (11.8) (20.4) 1.0
Unrealized transaction loss on Euro-denominated debt ........ — — (19.2)
Provision for losses on doubtful accounts ................ (31.1) (13.9) (17.1)
Asset writedowns ................................ (93.2) — —
Minority interest ................................. (20.8) (19.7) (16.7)
Deferred taxes on income .......................... 234.8 (59.7) (30.3)
Gain on sale of property and equipment ................. 9.6 24.8 9.7
Impairment charges .............................. (1,168.9) — —
Provision (benefit) for taxes on income .................. (196.9) 102.6 68.0
Interest expense, net of interest income .................. 845.2 875.4 900.7
Net changes in assets and liabilities .................... 340.6 (378.7) (265.5)
EBITDA ...................................... $1,874.9 $3,485.6 $3,100.7
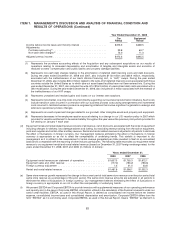
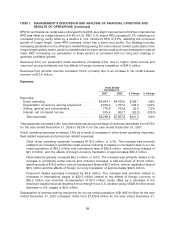
(5) For the years ended December 31, 2008, 2007 and 2006, non-cash expenses and charges were $83.0 million,
$60.4 million and $75.5 million, respectively, in our car rental segment and $0.0 million, $2.7 million and $(0.4) million,
respectively, in our equipment rental segment.
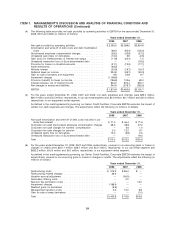
As defined in the credit agreements governing our Senior Credit Facilities, Corporate EBITDA excludes the impact of
certain non-cash expenses and charges. The adjustments reflect the following (in millions of dollars):
Years ended December 31,
2008 2007 2006
Non-cash amortization and write-off of debt costs included in car
rental fleet interest .............................. $ 71.0 $ 64.4 $ 71.6
Corporate non-cash stock-based employee compensation charges 28.0 26.8 27.2
Corporate non-cash charges for workers’ compensation ....... — 2.6 1.0
Corporate non-cash charges for pension ................. 2.0 12.2 9.1
Unrealized (gain) loss on derivatives .................... 12.0 (3.8) 2.5
Unrealized transaction loss on Euro-denominated debt ........ — — 19.2
Total ........................................ $113.0 $102.2 $130.6
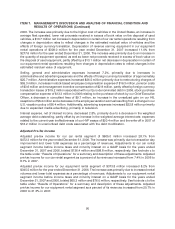
(6) For the years ended December 31, 2008, 2007 and 2006, extraordinary, unusual or non-recurring gains or losses or
charges or credits were $551.1 million, $38.7 million and $0.0 million, respectively, in our car rental segment and
$832.2 million, $(4.0) million and $0.0 million, respectively, in our equipment rental segment.
As defined in the credit agreements governing our Senior Credit Facilities, Corporate EBITDA excludes the impact of
extraordinary, unusual or non-recurring gains or losses or charges or credits. The adjustments reflect the following (in
millions of dollars):
Years ended December 31,
2008 2007 2006
Restructuring costs ............................... $ 216.2 $ 96.4 $ —
Restructuring related charges ........................ 26.3 — —
Vacation accrual adjustment ......................... — (36.5) —
Secondary offering costs ........................... — 2.0 —
Sponsor fee termination costs ........................ — — 15.0
Impairment charges .............................. 1,168.9 — —
Realized gains on derivatives ........................ (9.8) — —
Management transition costs ........................ 5.2 15.0 9.8
Gain on sale of swap derivatives ...................... — — (1.0)
Total ........................................ $1,406.8 $ 76.9 $23.8
84