Hertz 2008 Annual Report Download - page 111
Download and view the complete annual report
Please find page 111 of the 2008 Hertz annual report below. You can navigate through the pages in the report by either clicking on the pages listed below, or by using the keyword search tool below to find specific information within the annual report.-
 1
1 -
2
-
3
-
4
-
5
-
6
-
7
-
8
-
9
-
10
-
11
-
12
-
13
-
14
-
15
-
16
-
17
-
18
-
19
-
20
-
21
-
22
-
23
-
24
-
25
-
26
-
27
-
28
-
29
-
30
-
31
-
32
-
33
-
34
-
35
-
36
-
37
-
38
-
39
-
40
-
41
-
42
-
43
-
44
-
45
-
46
-
47
-
48
-
49
-
50
-
51
-
52
-
53
-
54
-
55
-
56
-
57
-
58
-
59
-
60
-
61
-
62
-
63
-
64
-
65
-
66
-
67
-
68
-
69
-
70
-
71
-
72
-
73
-
74
-
75
-
76
-
77
-
78
-
79
-
80
-
81
-
82
-
83
-
84
-
85
-
86
-
87
-
88
-
89
-
90
-
91
-
92
-
93
-
94
-
95
-
96
-
97
-
98
-
99
-
100
-
 101
101 -
 102
102 -
 103
103 -
 104
104 -
 105
105 -
 106
106 -
 107
107 -
 108
108 -
 109
109 -
 110
110 -
 111
111 -
 112
112 -
 113
113 -
 114
114 -
 115
115 -
 116
116 -
 117
117 -
 118
118 -
 119
119 -
 120
120 -
 121
121 -
122
-
123
-
124
-
125
-
126
-
127
-
128
-
129
-
130
-
131
-
132
-
133
-
134
-
135
-
136
-
137
-
138
-
139
-
140
-
141
-
142
-
143
-
144
-
145
-
146
-
147
-
148
-
149
-
150
-
151
-
152
-
153
-
154
-
155
-
156
-
157
-
158
-
159
-
160
-
161
-
162
-
163
-
164
-
165
-
166
-
167
-
168
-
169
-
170
-
171
-
172
-
173
-
174
-
175
-
176
-
177
-
178
-
179
-
180
-
181
-
182
-
183
-
184
-
185
-
186
-
187
-
188
-
189
-
190
-
191
-
192
-
193
-
194
-
195
-
196
-
197
-
198
-
199
-
200
-
201
-
202
-
203
-
204
-
205
-
206
-
207
-
208
-
209
-
210
-
211
-
212
-
213
-
214
-
215
-
216
-
217
-
218
-
219
-
220
-
221
-
222
-
223
-
224
-
225
-
226
-
227
-
228
-
229
-
230
-
231
-
232
-
233
-
234
-
235
-
236
-
237
-
238
-
239
-
240
-
241
-
242
-
243
-
244
-
245
-
246
-
247
-
248
-
249
-
250
-
251
-
252
 |
 |

ITEM 7. MANAGEMENT’S DISCUSSION AND ANALYSIS OF FINANCIAL CONDITION AND
RESULTS OF OPERATIONS (Continued)
The ratio of adjusted pre-tax income to revenues for our two segments reflects the different
environments in which they operate. Our infrastructure costs are higher within our car rental segment
due to the number and type of locations in which it operates and the corresponding headcount. Within
our equipment rental segment, our revenue earning equipment generates lower depreciation expense
due to its longer estimated useful life.
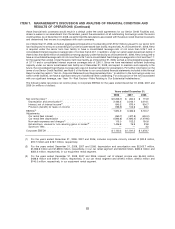
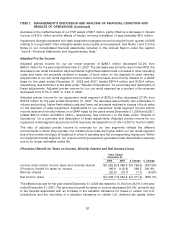
Provision for Taxes on Income, Minority Interest and Net Income
Years Ended
December 31,
2007 2006 $ Change % Change
Income before income taxes and minority interest ....... $386.8 $200.6 $186.2 92.8%
Provision for taxes on income ..................... (102.6) (68.0) (34.6) 50.9%
Minority interest ............................... (19.7) (16.7) (3.0) 17.8%
Net income .................................. $264.5 $115.9 $148.6 128.2%
The provision for taxes on income increased 50.9%, primarily due to an increase in income before
income taxes and minority interest. The effective tax rate for 2007 decreased to 26.5% from 33.9% in
2006, primarily due to a net reduction in the global valuation allowance and a reduction to the net
deferred tax liability attributable to decreases in statutory income tax rates in various jurisdictions. See
Note 7 to the Notes to our consolidated financial statements included in this Annual Report under the
caption ‘‘Item 8—Financial Statements and Supplementary Data.’’
Minority interest increased 17.8% primarily due to an increase in our majority-owned subsidiary
Navigation Solutions, L.L.C.’s net income in 2007 as compared to 2006.
Net income increased 128.2% primarily due to higher rental volume in our worldwide car and equipment
rental operations, partly offset by higher fleet costs, as well as the net effect of other contributing factors
noted above. The impact of changes in exchange rates on net income was mitigated by the fact that not
only international revenues but also most international expenses were incurred in local currencies.
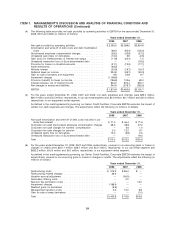
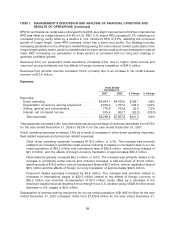
Effects of Acquisition
The following table summarizes the purchase accounting effects of the Acquisition on our results of
operations for the year ended December 31, 2007 (in millions of dollars):
Depreciation and amortization of tangible and intangible assets:
Other intangible assets ................................................ $ 61.2
Revenue earning equipment ............................................ 19.8
Property and equipment ............................................... 7.8
Accretion of revalued liabilities:
Discount on debt .................................................... 7.0
Workers’ compensation and public liability and property damage ................. 5.5
$101.3
Liquidity and Capital Resources
As of December 31, 2008, we had cash and equivalents of $594.3 million, a decrease of $135.9 million
from December 31, 2007. As of December 31, 2008, we had $731.4 million of restricted cash to be used
91