Hertz 2008 Annual Report Download - page 103
Download and view the complete annual report
Please find page 103 of the 2008 Hertz annual report below. You can navigate through the pages in the report by either clicking on the pages listed below, or by using the keyword search tool below to find specific information within the annual report.-
 1
1 -
2
-
3
-
4
-
5
-
6
-
7
-
8
-
9
-
10
-
11
-
12
-
13
-
14
-
15
-
16
-
17
-
18
-
19
-
20
-
21
-
22
-
23
-
24
-
25
-
26
-
27
-
28
-
29
-
30
-
31
-
32
-
33
-
34
-
35
-
36
-
37
-
38
-
39
-
40
-
41
-
42
-
43
-
44
-
45
-
46
-
47
-
48
-
49
-
50
-
51
-
52
-
53
-
54
-
55
-
56
-
57
-
58
-
59
-
60
-
61
-
62
-
63
-
64
-
65
-
66
-
67
-
68
-
69
-
70
-
71
-
72
-
73
-
74
-
75
-
76
-
77
-
78
-
79
-
80
-
81
-
82
-
83
-
84
-
85
-
86
-
87
-
88
-
89
-
90
-
91
-
92
-
 93
93 -
 94
94 -
 95
95 -
 96
96 -
 97
97 -
 98
98 -
 99
99 -
 100
100 -
 101
101 -
 102
102 -
 103
103 -
 104
104 -
 105
105 -
 106
106 -
 107
107 -
 108
108 -
 109
109 -
 110
110 -
 111
111 -
 112
112 -
 113
113 -
114
-
115
-
116
-
117
-
118
-
119
-
120
-
121
-
122
-
123
-
124
-
125
-
126
-
127
-
128
-
129
-
130
-
131
-
132
-
133
-
134
-
135
-
136
-
137
-
138
-
139
-
140
-
141
-
142
-
143
-
144
-
145
-
146
-
147
-
148
-
149
-
150
-
151
-
152
-
153
-
154
-
155
-
156
-
157
-
158
-
159
-
160
-
161
-
162
-
163
-
164
-
165
-
166
-
167
-
168
-
169
-
170
-
171
-
172
-
173
-
174
-
175
-
176
-
177
-
178
-
179
-
180
-
181
-
182
-
183
-
184
-
185
-
186
-
187
-
188
-
189
-
190
-
191
-
192
-
193
-
194
-
195
-
196
-
197
-
198
-
199
-
200
-
201
-
202
-
203
-
204
-
205
-
206
-
207
-
208
-
209
-
210
-
211
-
212
-
213
-
214
-
215
-
216
-
217
-
218
-
219
-
220
-
221
-
222
-
223
-
224
-
225
-
226
-
227
-
228
-
229
-
230
-
231
-
232
-
233
-
234
-
235
-
236
-
237
-
238
-
239
-
240
-
241
-
242
-
243
-
244
-
245
-
246
-
247
-
248
-
249
-
250
-
251
-
252
 |
 |

ITEM 7. MANAGEMENT’S DISCUSSION AND ANALYSIS OF FINANCIAL CONDITION AND
RESULTS OF OPERATIONS (Continued)
these financial ratio covenants would result in a default under the credit agreements for our Senior Credit Facilities and,
absent a waiver or an amendment from the lenders, permit the acceleration of all outstanding borrowings under the senior
credit facilities. As of December 31, 2008, we performed the calculations associated with the above noted financial covenants
and determined that we are in compliance with such covenants.
As of December 31, 2008, we had an aggregate principal amount outstanding of $1,372.2 million pursuant to our senior term
loan facility and no amounts outstanding of our senior asset-based loan facility, respectively. As of December 31, 2008, Hertz
is required under the senior term loan facility to have a consolidated leverage ratio of not more than 5.25:1 and a
consolidated interest expense coverage ratio of not less than 2.00:1. In addition, under our senior asset-based loan facility, if
there is less than $200 million of available borrowing capacity under that facility as of December 31, 2008, Hertz is required to
have a consolidated leverage ratio of not more than 5.25:1 and a consolidated fixed charge coverage ratio of not less than 1:1
for the quarter then ended. Under the senior term loan facility, as of December 31, 2008, we had a consolidated leverage ratio
of 3.71:1 and a consolidated interest expense coverage ratio of 2.90:1. Since we have maintained sufficient borrowing
capacity under our senior asset-based loan facility as of December 31, 2008, and expect to maintain such capacity in the
future, the consolidated fixed charge coverage ratio was not deemed relevant for presentation. For further information on the
terms of our Senior Credit Facilities, see Note 3 of the Notes to our consolidated financial statements included in this Annual
Report under the caption ‘‘Item 8—Financial Statements and Supplementary Data.’’ In addition to the borrowings under our
senior credit facilities, we have a significant amount of additional debt outstanding. For a discussion of the risks associated
with our significant leverage, see ‘‘Item 1A—Risk Factors—Risks Relating to Our Substantial Indebtedness.’’
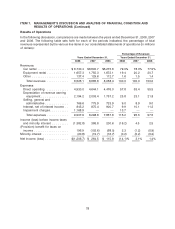
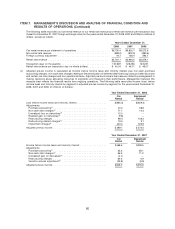
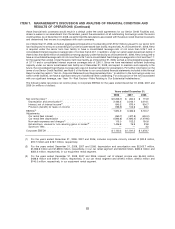
The following table reconciles net income (loss) to Corporate EBITDA for the years ended December 31, 2008, 2007 and
2006 (in millions of dollars):
Years ended December 31,
2008 2007 2006
Net income (loss)(1) .................................... $(1,206.7) $ 264.5 $ 115.9
Depreciation and amortization(2) ........................... 2,433.3 2,243.1 2,016.1
Interest, net of interest income(3) ........................... 845.2 875.4 900.7
Provision (benefit) for taxes on income ...................... (196.9) 102.6 68.0
EBITDA(4) .......................................... 1,874.9 3,485.6 3,100.7
Adjustments:
Car rental fleet interest ................................. (450.7) (427.8) (400.0)
Car rental fleet depreciation ............................. (1,843.8) (1,695.4) (1,479.6)
Non-cash expenses and charges(5) ......................... 113.0 102.2 130.6
Extraordinary, unusual or non-recurring gains or losses(6) ........... 1,406.8 76.9 23.8
Sponsors’ fees ...................................... — — 3.2
Corporate EBITDA ..................................... $1,100.2 $ 1,541.5 $ 1,378.7
(1) For the years ended December 31, 2008, 2007 and 2006, includes corporate minority interest of $20.8 million,
$19.7 million and $16.7 million, respectively.
(2) For the years ended December 31, 2008, 2007 and 2006, depreciation and amortization was $2,003.7 million,
$1,856.6 million and $1,659.8 million, respectively, in our car rental segment and $423.6 million, $380.6 million and
$350.3 million, respectively, in our equipment rental segment.
(3) For the years ended December 31, 2008, 2007 and 2006, interest, net of interest income was $444.8 million,
$436.8 million and $424.1 million, respectively, in our car rental segment and $109.5 million, $146.3 million and
$140.0 million, respectively, in our equipment rental segment.
83