Hertz 2008 Annual Report Download - page 90
Download and view the complete annual report
Please find page 90 of the 2008 Hertz annual report below. You can navigate through the pages in the report by either clicking on the pages listed below, or by using the keyword search tool below to find specific information within the annual report.-
 1
1 -
2
-
3
-
4
-
5
-
6
-
7
-
8
-
9
-
10
-
11
-
12
-
13
-
14
-
15
-
16
-
17
-
18
-
19
-
20
-
21
-
22
-
23
-
24
-
25
-
26
-
27
-
28
-
29
-
30
-
31
-
32
-
33
-
34
-
35
-
36
-
37
-
38
-
39
-
40
-
41
-
42
-
43
-
44
-
45
-
46
-
47
-
48
-
49
-
50
-
51
-
52
-
53
-
54
-
55
-
56
-
57
-
58
-
59
-
60
-
61
-
62
-
63
-
64
-
65
-
66
-
67
-
68
-
69
-
70
-
71
-
72
-
73
-
74
-
75
-
76
-
77
-
78
-
79
-
 80
80 -
 81
81 -
 82
82 -
 83
83 -
 84
84 -
 85
85 -
 86
86 -
 87
87 -
 88
88 -
 89
89 -
 90
90 -
 91
91 -
 92
92 -
 93
93 -
 94
94 -
 95
95 -
 96
96 -
 97
97 -
 98
98 -
 99
99 -
 100
100 -
101
-
102
-
103
-
104
-
105
-
106
-
107
-
108
-
109
-
110
-
111
-
112
-
113
-
114
-
115
-
116
-
117
-
118
-
119
-
120
-
121
-
122
-
123
-
124
-
125
-
126
-
127
-
128
-
129
-
130
-
131
-
132
-
133
-
134
-
135
-
136
-
137
-
138
-
139
-
140
-
141
-
142
-
143
-
144
-
145
-
146
-
147
-
148
-
149
-
150
-
151
-
152
-
153
-
154
-
155
-
156
-
157
-
158
-
159
-
160
-
161
-
162
-
163
-
164
-
165
-
166
-
167
-
168
-
169
-
170
-
171
-
172
-
173
-
174
-
175
-
176
-
177
-
178
-
179
-
180
-
181
-
182
-
183
-
184
-
185
-
186
-
187
-
188
-
189
-
190
-
191
-
192
-
193
-
194
-
195
-
196
-
197
-
198
-
199
-
200
-
201
-
202
-
203
-
204
-
205
-
206
-
207
-
208
-
209
-
210
-
211
-
212
-
213
-
214
-
215
-
216
-
217
-
218
-
219
-
220
-
221
-
222
-
223
-
224
-
225
-
226
-
227
-
228
-
229
-
230
-
231
-
232
-
233
-
234
-
235
-
236
-
237
-
238
-
239
-
240
-
241
-
242
-
243
-
244
-
245
-
246
-
247
-
248
-
249
-
250
-
251
-
252
 |
 |
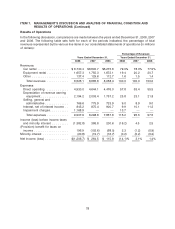
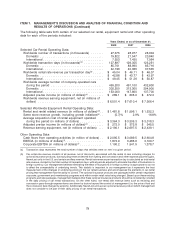
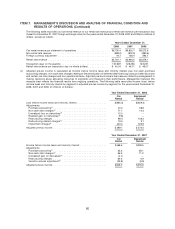
ITEM 7. MANAGEMENT’S DISCUSSION AND ANALYSIS OF FINANCIAL CONDITION AND
RESULTS OF OPERATIONS (Continued)
commercial construction and the industrial markets slow. The United States and international markets
are currently experiencing a significant decline in economic activities, including a tightening of the credit
markets, reduced airline passenger traffic, reduced consumer spending and volatile fuel prices. These
conditions are expected to continue in 2009. During 2008, this resulted in a rapid decline in the volume of
car rental and equipment rental transactions, an increase in depreciation and fleet related costs as a
percentage of revenue, lower industry pricing and lower residual values for the non-program cars and
equipment that we sold. See ‘‘Item 1A—Risk Factors’’ in this Annual Report.
Our profitability is primarily a function of the volume, mix and pricing of rental transactions and the
utilization of cars and equipment. Significant changes in the purchase price or residual values of cars
and equipment or interest rates can also have a significant effect on our profitability depending on our
ability to adjust pricing for these changes. In the United States, 2007 model year program vehicle
depreciation costs rose approximately 15% and per-car depreciation costs for 2007 model year U.S.
non-program cars declined as compared to 2006. As a consequence of those changes in per-car costs,
as well as the larger proportion of our U.S. fleet we purchased as non-program cars and other actions we
took to mitigate program car cost increases, our net per-car depreciation costs for 2007 model year cars
increased by less than 3% from our net per-car depreciation costs for 2006 model year U.S. cars. We
continue to have an overall strategy of increasing the proportion of non-program cars we have in our
worldwide fleet. However in 2008, given the recent economic downturn described above, we sold a
higher proportion of non-program cars during the third quarter, when the used car market is traditionally
stronger, to reduce exposure to residual value declines in the fourth quarter. Accordingly, for the year
ended December 31, 2008, the percentage of non-program cars in the U.S. fleet decreased from 58% to
46% as compared to the year ended December 31, 2007; however, the percentage of non-program cars
increased slightly internationally and for the year ended December 31, 2008, the percentage of
non-program cars in our international fleet was 41%, compared to 35% for the year ended December 31,
2007.
Our per car vehicle depreciation costs in the United States for 2008 increased approximately 6% from
our net per car depreciation costs for 2007 and increased approximately 20% in Europe year-over-year.
We expect our per car vehicle depreciation costs in the United States and in Europe for 2009 to be similar
to 2008. Our business requires significant expenditures for cars and equipment, and consequently we
require substantial liquidity to finance such expenditures. See ‘‘Liquidity and Capital Resources’’ below.
Our car rental and equipment rental operations are seasonal businesses, with decreased levels of
business in the winter months and heightened activity during the spring and summer. We have the ability
to dynamically manage fleet capacity, the most significant portion of our cost structure, to meet market
demand. For instance, to accommodate increased demand, we increase our available fleet and staff
during the second and third quarters of the year. As business demand declines, fleet and staff are
decreased accordingly. A number of our other major operating costs, including airport concession fees,
commissions and vehicle liability expenses, are directly related to revenues or transaction volumes. In
addition, our management expects to utilize enhanced process improvements, including efficiency
initiatives and the use of our information technology systems, to help manage our variable costs.
Approximately two-thirds of our typical annual operating costs represent variable costs, while the
remaining one-third is fixed or semi-fixed. We also maintain a flexible workforce, with a significant
number of part time and seasonal workers. However, certain operating expenses, including minimum
concession fees, rent, insurance, and administrative overhead, remain fixed and cannot be adjusted for
seasonal demand.
70