Hertz 2008 Annual Report Download - page 174
Download and view the complete annual report
Please find page 174 of the 2008 Hertz annual report below. You can navigate through the pages in the report by either clicking on the pages listed below, or by using the keyword search tool below to find specific information within the annual report.-
 1
1 -
2
-
3
-
4
-
5
-
6
-
7
-
8
-
9
-
10
-
11
-
12
-
13
-
14
-
15
-
16
-
17
-
18
-
19
-
20
-
21
-
22
-
23
-
24
-
25
-
26
-
27
-
28
-
29
-
30
-
31
-
32
-
33
-
34
-
35
-
36
-
37
-
38
-
39
-
40
-
41
-
42
-
43
-
44
-
45
-
46
-
47
-
48
-
49
-
50
-
51
-
52
-
53
-
54
-
55
-
56
-
57
-
58
-
59
-
60
-
61
-
62
-
63
-
64
-
65
-
66
-
67
-
68
-
69
-
70
-
71
-
72
-
73
-
74
-
75
-
76
-
77
-
78
-
79
-
80
-
81
-
82
-
83
-
84
-
85
-
86
-
87
-
88
-
89
-
90
-
91
-
92
-
93
-
94
-
95
-
96
-
97
-
98
-
99
-
100
-
101
-
102
-
103
-
104
-
105
-
106
-
107
-
108
-
109
-
110
-
111
-
112
-
113
-
114
-
115
-
116
-
117
-
118
-
119
-
120
-
121
-
122
-
123
-
124
-
125
-
126
-
127
-
128
-
129
-
130
-
131
-
132
-
133
-
134
-
135
-
136
-
137
-
138
-
139
-
140
-
141
-
142
-
143
-
144
-
145
-
146
-
147
-
148
-
149
-
150
-
151
-
152
-
153
-
154
-
155
-
156
-
157
-
158
-
159
-
160
-
161
-
162
-
163
-
 164
164 -
 165
165 -
 166
166 -
 167
167 -
 168
168 -
 169
169 -
 170
170 -
 171
171 -
 172
172 -
 173
173 -
 174
174 -
 175
175 -
 176
176 -
 177
177 -
 178
178 -
 179
179 -
 180
180 -
 181
181 -
 182
182 -
 183
183 -
 184
184 -
185
-
186
-
187
-
188
-
189
-
190
-
191
-
192
-
193
-
194
-
195
-
196
-
197
-
198
-
199
-
200
-
201
-
202
-
203
-
204
-
205
-
206
-
207
-
208
-
209
-
210
-
211
-
212
-
213
-
214
-
215
-
216
-
217
-
218
-
219
-
220
-
221
-
222
-
223
-
224
-
225
-
226
-
227
-
228
-
229
-
230
-
231
-
232
-
233
-
234
-
235
-
236
-
237
-
238
-
239
-
240
-
241
-
242
-
243
-
244
-
245
-
246
-
247
-
248
-
249
-
250
-
251
-
252
 |
 |

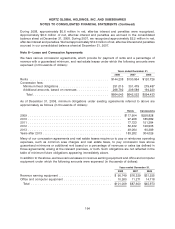
HERTZ GLOBAL HOLDINGS, INC. AND SUBSIDIARIES
NOTES TO CONSOLIDATED FINANCIAL STATEMENTS (Continued)
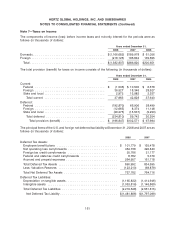
The provisions charged to income for the years ended December 31, 2008, 2007 and 2006 for all other
pension plans were approximately (in millions of dollars) $8.0, $7.8 and $8.0, respectively.
The provisions charged to income for the years ended December 31, 2008, 2007 and 2006 for the
defined contribution plans were approximately (in millions of dollars) $16.3, $15.6 and $15.1,
respectively.
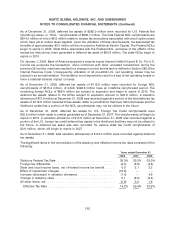
Plan Assets
We have a long-term investment outlook for the assets held in our Company sponsored plans, which is
consistent with the long-term nature of each plan’s respective liabilities. We have two major plans which
reside in the U.S. and the U.K.
The U.S. Plan, or the ‘‘Plan,’’ currently has a target asset allocation of 70% equity and 30% fixed income.
The equity portion of the Plan is invested in one passively managed S&P 500 index fund, one passively
managed U.S. small/midcap fund and one actively managed international portfolio. The fixed income
portion of the Plan is actively managed by a professional investment manager and is benchmarked to
the Barclays Long Govt/Credit Index. The Plan assumes an 8.25% rate of return on assets, which
represents the expected long-term annual weighted-average return for the Plan in total.
The U.K. Plan currently invests in a professionally managed Balanced Consensus Index Fund, which has
the investment objective of achieving a total return relatively equal to its benchmark. The benchmark is
based upon the average asset weightings of a broad universe of U.K. pension funds invested in pooled
investment vehicles and each of their relevant indices. The asset allocation as of December 31, 2008,
was 82% equity, 11% fixed income and 7% cash. The U.K. Plan currently assumes a rate of return on
assets of 6.8%, which represents the expected long-term annual weighted-average return.
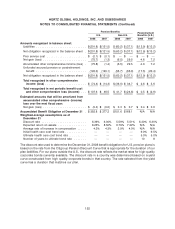
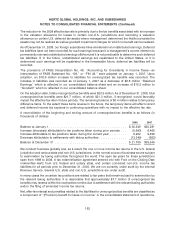
The fair value measurements of our U.S. pension plan assets at December 31, 2008 are as follows (in
millions of dollars):
Cash .................................................. $ 1.6
Equity Securities:
U.S. Large Cap ......................................... 57.4
U.S. Mid Cap .......................................... 15.4
U.S. Small Cap ......................................... 12.6
International Large Cap ................................... 42.6
Fixed Income Securities:
U.S. Treasuries ......................................... 54.4
Corporate Bonds ....................................... 43.2
Mortgage-backed Bonds .................................. 8.2
Real Estate (REITs) ....................................... 1.6
Total fair value of pension plan assets ....................... $237.0
Note: All values based on quoted prices in active markets for similar assets (Level 1).
154