Hertz 2008 Annual Report Download - page 40
Download and view the complete annual report
Please find page 40 of the 2008 Hertz annual report below. You can navigate through the pages in the report by either clicking on the pages listed below, or by using the keyword search tool below to find specific information within the annual report.-
 1
1 -
2
-
3
-
4
-
5
-
6
-
7
-
8
-
9
-
10
-
11
-
12
-
13
-
14
-
15
-
16
-
17
-
18
-
19
-
20
-
21
-
22
-
23
-
24
-
25
-
26
-
27
-
28
-
29
-
 30
30 -
 31
31 -
 32
32 -
 33
33 -
 34
34 -
 35
35 -
 36
36 -
 37
37 -
 38
38 -
 39
39 -
 40
40 -
 41
41 -
 42
42 -
 43
43 -
 44
44 -
 45
45 -
 46
46 -
 47
47 -
 48
48 -
 49
49 -
 50
50 -
51
-
52
-
53
-
54
-
55
-
56
-
57
-
58
-
59
-
60
-
61
-
62
-
63
-
64
-
65
-
66
-
67
-
68
-
69
-
70
-
71
-
72
-
73
-
74
-
75
-
76
-
77
-
78
-
79
-
80
-
81
-
82
-
83
-
84
-
85
-
86
-
87
-
88
-
89
-
90
-
91
-
92
-
93
-
94
-
95
-
96
-
97
-
98
-
99
-
100
-
101
-
102
-
103
-
104
-
105
-
106
-
107
-
108
-
109
-
110
-
111
-
112
-
113
-
114
-
115
-
116
-
117
-
118
-
119
-
120
-
121
-
122
-
123
-
124
-
125
-
126
-
127
-
128
-
129
-
130
-
131
-
132
-
133
-
134
-
135
-
136
-
137
-
138
-
139
-
140
-
141
-
142
-
143
-
144
-
145
-
146
-
147
-
148
-
149
-
150
-
151
-
152
-
153
-
154
-
155
-
156
-
157
-
158
-
159
-
160
-
161
-
162
-
163
-
164
-
165
-
166
-
167
-
168
-
169
-
170
-
171
-
172
-
173
-
174
-
175
-
176
-
177
-
178
-
179
-
180
-
181
-
182
-
183
-
184
-
185
-
186
-
187
-
188
-
189
-
190
-
191
-
192
-
193
-
194
-
195
-
196
-
197
-
198
-
199
-
200
-
201
-
202
-
203
-
204
-
205
-
206
-
207
-
208
-
209
-
210
-
211
-
212
-
213
-
214
-
215
-
216
-
217
-
218
-
219
-
220
-
221
-
222
-
223
-
224
-
225
-
226
-
227
-
228
-
229
-
230
-
231
-
232
-
233
-
234
-
235
-
236
-
237
-
238
-
239
-
240
-
241
-
242
-
243
-
244
-
245
-
246
-
247
-
248
-
249
-
250
-
251
-
252
 |
 |
ITEM 1. BUSINESS (Continued)
As of December 31, 2008, HERC operated 345 equipment rental branches, of which 222 were in 38
states within the United States, 36 were in eight provinces within Canada, 80 were in France, six were in
Spain and one was in China. HERC’s rental locations generally are situated in industrial or commercial
zones. A growing number of locations have highway or major thoroughfare visibility. The typical location
is approximately three acres in size, though smaller in Europe, and includes a customer service center,
an equipment service area and storage facilities for equipment. The branches are built or conform to the
specifications of the HERC prototype branch, which stresses efficiency, safety and environmental
compliance. Most branches have stand-alone maintenance and fueling facilities and showrooms.
During the years ended December 31, 2006, 2007 and 2008 (excluding additions relating to
acquisitions), HERC had a net increase of eight and six and a net decrease of 27 U.S. locations,
respectively, two, one and two new Canadian location(s), respectively, and seven, seven and a net
decrease of 10 locations in Europe, respectively, and one location opening in China in 2008. In
connection with new location openings in the U.S., we expect HERC will incur non-fleet start-up costs of
approximately $0.8 million per location and additional fleet acquisition costs, excluding equipment
transferred from other branches, over an initial twelve-month period of approximately $1 to $3 million per
location. In connection with new location openings in Europe, we expect HERC will incur lower start-up
costs per location as compared with the United States.
During the year ended December 31, 2008, we added four locations related to external acquisitions
done within our domestic and international equipment rental operations. These acquisitions give us
greater control over our growth both in the United States and internationally and an expanded array of
services across the Hertz network. See Note 2 to the Notes to our consolidated financial statements
included in this Annual Report under the caption ‘‘Item 8—Financial Statements and Supplementary
Data.’’
Starting in 2004, HERC began to broaden its equipment line in the United States and Canada to include
more equipment with an acquisition cost of under $10,000 per unit, ranging from air compressors and
generators to small tools and accessories, in order to supply customers who are local contractors with a
greater proportion of their overall equipment rental needs. As of December 31, 2008, these activities,
referred to as ‘‘general rental activities,’’ were conducted at approximately 47% of HERC’s U.S. and
Canadian rental locations. Before it begins to conduct general rental activities at a location, HERC
typically renovates the location to make it more appealing to walk-in customers and adds staff and
equipment in anticipation of subsequent demand.
Our worldwide equipment rental segment generated $1,658.1 million in revenues and $629.3 million in
loss before income taxes and minority interest during the year ended December 31, 2008.
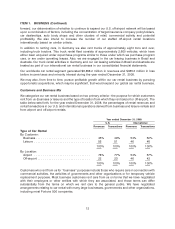
Customers
HERC’s customers consist predominantly of commercial accounts and represent a wide variety of
industries, such as construction, petrochemical, automobile manufacturing, railroad, power generation
and shipbuilding. Serving a number of different industries enables HERC to reduce its dependence on a
single or limited number of customers in the same business and somewhat reduces the seasonality of
HERC’s revenues and its dependence on construction cycles. HERC primarily targets customers in
medium to large metropolitan markets. For the year ended December 31, 2008, no customer of HERC
accounted for more than 2.0% of HERC’s rental revenues. Of HERC’s combined U.S. and Canadian
rental revenues for the year ended December 31, 2008, roughly half were derived from customers
operating in the construction industry (the majority of which were in the non-residential sector), while the
remaining revenues were derived from rentals to industrial, governmental and other types of customers.
20