Hertz 2008 Annual Report Download - page 98
Download and view the complete annual report
Please find page 98 of the 2008 Hertz annual report below. You can navigate through the pages in the report by either clicking on the pages listed below, or by using the keyword search tool below to find specific information within the annual report.-
 1
1 -
2
-
3
-
4
-
5
-
6
-
7
-
8
-
9
-
10
-
11
-
12
-
13
-
14
-
15
-
16
-
17
-
18
-
19
-
20
-
21
-
22
-
23
-
24
-
25
-
26
-
27
-
28
-
29
-
30
-
31
-
32
-
33
-
34
-
35
-
36
-
37
-
38
-
39
-
40
-
41
-
42
-
43
-
44
-
45
-
46
-
47
-
48
-
49
-
50
-
51
-
52
-
53
-
54
-
55
-
56
-
57
-
58
-
59
-
60
-
61
-
62
-
63
-
64
-
65
-
66
-
67
-
68
-
69
-
70
-
71
-
72
-
73
-
74
-
75
-
76
-
77
-
78
-
79
-
80
-
81
-
82
-
83
-
84
-
85
-
86
-
87
-
 88
88 -
 89
89 -
 90
90 -
 91
91 -
 92
92 -
 93
93 -
 94
94 -
 95
95 -
 96
96 -
 97
97 -
 98
98 -
 99
99 -
 100
100 -
 101
101 -
 102
102 -
 103
103 -
 104
104 -
 105
105 -
 106
106 -
 107
107 -
 108
108 -
109
-
110
-
111
-
112
-
113
-
114
-
115
-
116
-
117
-
118
-
119
-
120
-
121
-
122
-
123
-
124
-
125
-
126
-
127
-
128
-
129
-
130
-
131
-
132
-
133
-
134
-
135
-
136
-
137
-
138
-
139
-
140
-
141
-
142
-
143
-
144
-
145
-
146
-
147
-
148
-
149
-
150
-
151
-
152
-
153
-
154
-
155
-
156
-
157
-
158
-
159
-
160
-
161
-
162
-
163
-
164
-
165
-
166
-
167
-
168
-
169
-
170
-
171
-
172
-
173
-
174
-
175
-
176
-
177
-
178
-
179
-
180
-
181
-
182
-
183
-
184
-
185
-
186
-
187
-
188
-
189
-
190
-
191
-
192
-
193
-
194
-
195
-
196
-
197
-
198
-
199
-
200
-
201
-
202
-
203
-
204
-
205
-
206
-
207
-
208
-
209
-
210
-
211
-
212
-
213
-
214
-
215
-
216
-
217
-
218
-
219
-
220
-
221
-
222
-
223
-
224
-
225
-
226
-
227
-
228
-
229
-
230
-
231
-
232
-
233
-
234
-
235
-
236
-
237
-
238
-
239
-
240
-
241
-
242
-
243
-
244
-
245
-
246
-
247
-
248
-
249
-
250
-
251
-
252
 |
 |

ITEM 7. MANAGEMENT’S DISCUSSION AND ANALYSIS OF FINANCIAL CONDITION AND
RESULTS OF OPERATIONS (Continued)
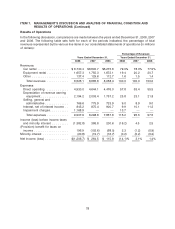
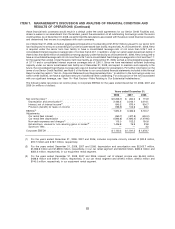
Results of Operations
In the following discussion, comparisons are made between the years ended December 31, 2008, 2007
and 2006. The following table sets forth for each of the periods indicated, the percentage of total
revenues represented by the various line items in our consolidated statements of operations (in millions
of dollars):
Percentage of Revenues
Years Ended December 31, Years Ended December 31,
2008 2007 2006 2008 2007 2006
Revenues:
Car rental ................. $6,730.4 $6,800.7 $6,273.6 79.0% 78.3% 77.9%
Equipment rental ............ 1,657.3 1,755.3 1,672.1 19.4 20.2 20.7
Other .................... 137.4 129.6 112.7 1.6 1.5 1.4
Total revenues ............ 8,525.1 8,685.6 8,058.4 100.0 100.0 100.0
Expenses:
Direct operating ............ 4,930.0 4,644.1 4,476.0 57.8 53.4 55.5
Depreciation of revenue earning
equipment ............... 2,194.2 2,003.4 1,757.2 25.8 23.1 21.8
Selling, general and
administrative ............. 769.6 775.9 723.9 9.0 8.9 9.0
Interest, net of interest income . . 845.2 875.4 900.7 9.9 10.1 11.2
Impairment charges .......... 1,168.9 — — 13.7 — —
Total expenses ............ 9,907.9 8,298.8 7,857.8 116.2 95.5 97.5
Income (loss) before income taxes
and minority interest ......... (1,382.8) 386.8 200.6 (16.2) 4.5 2.5
(Provision) benefit for taxes on
income ................... 196.9 (102.6) (68.0) 2.3 (1.2) (0.9)
Minority interest .............. (20.8) (19.7) (16.7) (0.2) (0.2) (0.2)
Net income (loss) ............. $(1,206.7) $ 264.5 $ 115.9 (14.1)% 3.1% 1.4%
78