Hertz 2008 Annual Report Download - page 95
Download and view the complete annual report
Please find page 95 of the 2008 Hertz annual report below. You can navigate through the pages in the report by either clicking on the pages listed below, or by using the keyword search tool below to find specific information within the annual report.-
 1
1 -
2
-
3
-
4
-
5
-
6
-
7
-
8
-
9
-
10
-
11
-
12
-
13
-
14
-
15
-
16
-
17
-
18
-
19
-
20
-
21
-
22
-
23
-
24
-
25
-
26
-
27
-
28
-
29
-
30
-
31
-
32
-
33
-
34
-
35
-
36
-
37
-
38
-
39
-
40
-
41
-
42
-
43
-
44
-
45
-
46
-
47
-
48
-
49
-
50
-
51
-
52
-
53
-
54
-
55
-
56
-
57
-
58
-
59
-
60
-
61
-
62
-
63
-
64
-
65
-
66
-
67
-
68
-
69
-
70
-
71
-
72
-
73
-
74
-
75
-
76
-
77
-
78
-
79
-
80
-
81
-
82
-
83
-
84
-
 85
85 -
 86
86 -
 87
87 -
 88
88 -
 89
89 -
 90
90 -
 91
91 -
 92
92 -
 93
93 -
 94
94 -
 95
95 -
 96
96 -
 97
97 -
 98
98 -
 99
99 -
 100
100 -
 101
101 -
 102
102 -
 103
103 -
 104
104 -
 105
105 -
106
-
107
-
108
-
109
-
110
-
111
-
112
-
113
-
114
-
115
-
116
-
117
-
118
-
119
-
120
-
121
-
122
-
123
-
124
-
125
-
126
-
127
-
128
-
129
-
130
-
131
-
132
-
133
-
134
-
135
-
136
-
137
-
138
-
139
-
140
-
141
-
142
-
143
-
144
-
145
-
146
-
147
-
148
-
149
-
150
-
151
-
152
-
153
-
154
-
155
-
156
-
157
-
158
-
159
-
160
-
161
-
162
-
163
-
164
-
165
-
166
-
167
-
168
-
169
-
170
-
171
-
172
-
173
-
174
-
175
-
176
-
177
-
178
-
179
-
180
-
181
-
182
-
183
-
184
-
185
-
186
-
187
-
188
-
189
-
190
-
191
-
192
-
193
-
194
-
195
-
196
-
197
-
198
-
199
-
200
-
201
-
202
-
203
-
204
-
205
-
206
-
207
-
208
-
209
-
210
-
211
-
212
-
213
-
214
-
215
-
216
-
217
-
218
-
219
-
220
-
221
-
222
-
223
-
224
-
225
-
226
-
227
-
228
-
229
-
230
-
231
-
232
-
233
-
234
-
235
-
236
-
237
-
238
-
239
-
240
-
241
-
242
-
243
-
244
-
245
-
246
-
247
-
248
-
249
-
250
-
251
-
252
 |
 |
ITEM 7. MANAGEMENT’S DISCUSSION AND ANALYSIS OF FINANCIAL CONDITION AND
RESULTS OF OPERATIONS (Continued)
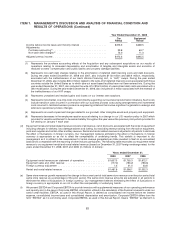
accordance with SFAS No. 142, ‘‘Goodwill and Other Intangible Assets.’’ Under SFAS No. 142, goodwill
impairment is deemed to exist if the carrying value of goodwill exceeds its fair value. In addition, SFAS
No. 142 requires that goodwill be tested at least annually using a two-step process. The first step is to
identify any potential impairment by comparing the carrying value of the reporting unit to its fair value.
We estimate the fair value of our reporting units using a discounted cash flow methodology. The cash
flows represent management’s most recent planning assumptions. These assumptions are based on a
combination of industry outlooks, views on general economic conditions, our expected pricing plans
and expected future savings generated by our ongoing restructuring activities. If a potential impairment
is identified, the second step is to compare the implied fair value of goodwill with its carrying amount to
measure the impairment loss. A significant decline in the projected cash flows or a change in the
weighted average cost of capital used to determine fair value could result in a future goodwill impairment
charge.
In the fourth quarter 2008, we performed our annual impairment analysis based upon market data as of
October 1, 2008. In addition, we performed an additional analysis as of December 31, 2008 due to the
fact that there had been a decline in operating results and worldwide economies, and a decline in both
the fair value of our debt and our stock price.
We performed the impairment analyses for our reporting units, using our business and long-term
strategic plans, revised to reflect the current economic conditions. Our weighted-average cost of capital
used in the discounted cash flow model was calculated based upon the fair value of our debt and our
stock price with a debt to equity ratio comparable to our industry. The total fair value of our reporting
units was then compared to our market capitalization to ensure their reasonableness.
For those reporting units which failed the first step of the analysis, fair values were obtained for long-lived
assets and intangibles. The fair value of our debt was calculated based upon current market rates and
deferred taxes were calculated for our intangible asset impairment charges (discussed below). Based
upon the comparison of the fair value of equity to the fair value of our assets and liabilities, we concluded
that impairment of all of the goodwill for these reporting units existed. This resulted in a non-cash
impairment charge of $694.9 million in the fourth quarter of 2008.
As a result of the Acquisition, we also have recognized significant intangible assets. In accordance with
SFAS No. 142, we re-evaluate the estimated useful lives of our intangible assets annually or as
circumstances change. Those intangible assets considered to have indefinite useful lives, including our
trade name, are evaluated for impairment on an annual basis, by comparing the fair value of the
intangible assets to their carrying value. In addition, whenever events or changes in circumstances
indicate that the carrying value of intangible assets might not be recoverable, we will perform an
impairment review. Intangible assets with finite useful lives are amortized over their respective estimated
useful lives and reviewed for impairment in accordance with SFAS No. 144, ‘‘Accounting for Impairment
or Disposal of Long-Lived Assets.’’
The valuation of our indefinite-lived assets utilized the relief from royalty method, which incorporates
cash flows and discount rates comparable to those discussed above. The royalty rates utilized in this
valuation were based on actual licensing agreements. We also considered the excess earnings as a
percentage of revenues to ensure their reasonableness. Our analysis resulted in an impairment charge
of $451.0 million recorded in the fourth quarter of 2008.
As of December 31, 2008, our goodwill and other intangible assets had remaining carrying values of
$264.1 million and $2,621.6 million, respectively. We will continue to monitor the market conditions and
75