Hertz 2008 Annual Report Download - page 110
Download and view the complete annual report
Please find page 110 of the 2008 Hertz annual report below. You can navigate through the pages in the report by either clicking on the pages listed below, or by using the keyword search tool below to find specific information within the annual report.-
 1
1 -
2
-
3
-
4
-
5
-
6
-
7
-
8
-
9
-
10
-
11
-
12
-
13
-
14
-
15
-
16
-
17
-
18
-
19
-
20
-
21
-
22
-
23
-
24
-
25
-
26
-
27
-
28
-
29
-
30
-
31
-
32
-
33
-
34
-
35
-
36
-
37
-
38
-
39
-
40
-
41
-
42
-
43
-
44
-
45
-
46
-
47
-
48
-
49
-
50
-
51
-
52
-
53
-
54
-
55
-
56
-
57
-
58
-
59
-
60
-
61
-
62
-
63
-
64
-
65
-
66
-
67
-
68
-
69
-
70
-
71
-
72
-
73
-
74
-
75
-
76
-
77
-
78
-
79
-
80
-
81
-
82
-
83
-
84
-
85
-
86
-
87
-
88
-
89
-
90
-
91
-
92
-
93
-
94
-
95
-
96
-
97
-
98
-
99
-
 100
100 -
 101
101 -
 102
102 -
 103
103 -
 104
104 -
 105
105 -
 106
106 -
 107
107 -
 108
108 -
 109
109 -
 110
110 -
 111
111 -
 112
112 -
 113
113 -
 114
114 -
 115
115 -
 116
116 -
 117
117 -
 118
118 -
 119
119 -
 120
120 -
121
-
122
-
123
-
124
-
125
-
126
-
127
-
128
-
129
-
130
-
131
-
132
-
133
-
134
-
135
-
136
-
137
-
138
-
139
-
140
-
141
-
142
-
143
-
144
-
145
-
146
-
147
-
148
-
149
-
150
-
151
-
152
-
153
-
154
-
155
-
156
-
157
-
158
-
159
-
160
-
161
-
162
-
163
-
164
-
165
-
166
-
167
-
168
-
169
-
170
-
171
-
172
-
173
-
174
-
175
-
176
-
177
-
178
-
179
-
180
-
181
-
182
-
183
-
184
-
185
-
186
-
187
-
188
-
189
-
190
-
191
-
192
-
193
-
194
-
195
-
196
-
197
-
198
-
199
-
200
-
201
-
202
-
203
-
204
-
205
-
206
-
207
-
208
-
209
-
210
-
211
-
212
-
213
-
214
-
215
-
216
-
217
-
218
-
219
-
220
-
221
-
222
-
223
-
224
-
225
-
226
-
227
-
228
-
229
-
230
-
231
-
232
-
233
-
234
-
235
-
236
-
237
-
238
-
239
-
240
-
241
-
242
-
243
-
244
-
245
-
246
-
247
-
248
-
249
-
250
-
251
-
252
 |
 |
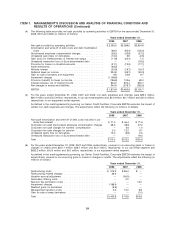
ITEM 7. MANAGEMENT’S DISCUSSION AND ANALYSIS OF FINANCIAL CONDITION AND
RESULTS OF OPERATIONS (Continued)
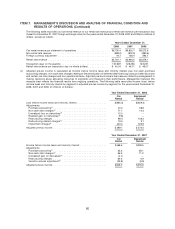
2006. The increase was primarily due to the higher cost of vehicles in the United States, an increase in
average fleet operated, lower net proceeds received in excess of book value on the disposal of used
vehicles, a $13.7 million net increase in depreciation in certain of our car rental operations resulting from
changes in depreciation rates to reflect changes in the estimated residual value of vehicles and the
effects of foreign currency translation. Depreciation of revenue earning equipment in our equipment
rental operations of $308.0 million for the year ended December 31, 2007 increased 11.0% from
$277.6 million for the year ended December 31, 2006. The increase was primarily due to an increase in
the quantity of equipment operated, as well as lower net proceeds received in excess of book value on
the disposal of used equipment, partly offset by a $13.1 million net decrease in depreciation in certain of
our equipment rental operations resulting from changes in depreciation rates to reflect changes in the
estimated residual value of equipment.
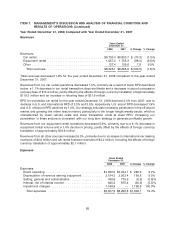
Selling, general and administrative expenses increased 7.2%, primarily due to increases in
administrative and advertising expenses and the effects of foreign currency translation of approximately
$25.7 million. Administrative expenses increased $26.5 million primarily due to restructuring charges of
$55.3 million, increases in stock-based employee compensation expense of $16.3 million, pension costs
of $3.6 million and management incentive compensation of $2.9 million, partly offset by foreign currency
transaction losses of $19.2 million associated with our Euro-denominated debt in 2006, stock purchase
compensation expense of $13.3 million in 2006 relating to the purchase of stock by our Chief Executive
Officer, a decrease in consultant fees of $9.7 million, an increase in the unrealized gain on our HIL
swaptions of $6.4 million and a decrease in the employee vacation accrual resulting from a change in our
U.S. vacation policy of $6.4 million. Additionally, advertising expenses increased $22.8 million primarily
due to expanded media advertising, primarily in television.
Interest expense, net of interest income, decreased 2.8%, primarily due to a decrease in the weighted
average debt outstanding, partly offset by an increase in the weighted average interest rate, expenses
related to the current year ineffectiveness of our HVF swaps of $20.4 million and the write-off in 2007 of
$16.2 million in unamortized debt costs associated with the debt modification.
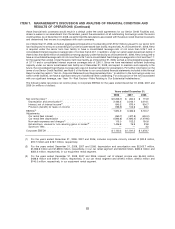
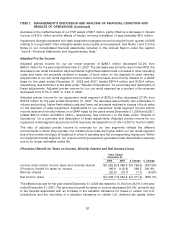
Adjusted Pre-Tax Income
Adjusted pre-tax income for our car rental segment of $605.0 million increased 28.1% from
$472.3 million for the year ended December 31, 2006. The increase was primarily due to transaction day
improvement and lower total expenses as a percentage of revenues. Adjustments to our car rental
segment income before income taxes and minority interest on a GAAP basis for the years ended
December 31, 2007 and 2006, totaled $136.4 million and $98.8 million, respectively. See footnote c to
the table under ‘‘Results of Operations’’ for a summary and description of these adjustments. Adjusted
pre-tax income for our car rental segment as a percent of its revenues increased from 7.4% in 2006 to
8.7% in 2007.
Adjusted pre-tax income for our equipment rental segment of $373.8 million increased 8.2% from
$345.5 million for the year ended December 31, 2006. The increase was primarily due to increased rental
volumes and lower total expenses as a percentage of revenues. Adjustments to our equipment rental
segment income before income taxes and minority interest on a GAAP basis for the years ended
December 31, 2007 and 2006, totaled $65.3 million and $76.0 million, respectively. See footnote c to the
table under ‘‘Results of Operations’’ for a summary and description of these adjustments. Adjusted
pre-tax income for our equipment rental segment as a percent of its revenues increased from 20.7% in
2006 to 21.3% in 2007.
90