Hertz 2008 Annual Report Download - page 101
Download and view the complete annual report
Please find page 101 of the 2008 Hertz annual report below. You can navigate through the pages in the report by either clicking on the pages listed below, or by using the keyword search tool below to find specific information within the annual report.-
 1
1 -
2
-
3
-
4
-
5
-
6
-
7
-
8
-
9
-
10
-
11
-
12
-
13
-
14
-
15
-
16
-
17
-
18
-
19
-
20
-
21
-
22
-
23
-
24
-
25
-
26
-
27
-
28
-
29
-
30
-
31
-
32
-
33
-
34
-
35
-
36
-
37
-
38
-
39
-
40
-
41
-
42
-
43
-
44
-
45
-
46
-
47
-
48
-
49
-
50
-
51
-
52
-
53
-
54
-
55
-
56
-
57
-
58
-
59
-
60
-
61
-
62
-
63
-
64
-
65
-
66
-
67
-
68
-
69
-
70
-
71
-
72
-
73
-
74
-
75
-
76
-
77
-
78
-
79
-
80
-
81
-
82
-
83
-
84
-
85
-
86
-
87
-
88
-
89
-
90
-
 91
91 -
 92
92 -
 93
93 -
 94
94 -
 95
95 -
 96
96 -
 97
97 -
 98
98 -
 99
99 -
 100
100 -
 101
101 -
 102
102 -
 103
103 -
 104
104 -
 105
105 -
 106
106 -
 107
107 -
 108
108 -
 109
109 -
 110
110 -
 111
111 -
112
-
113
-
114
-
115
-
116
-
117
-
118
-
119
-
120
-
121
-
122
-
123
-
124
-
125
-
126
-
127
-
128
-
129
-
130
-
131
-
132
-
133
-
134
-
135
-
136
-
137
-
138
-
139
-
140
-
141
-
142
-
143
-
144
-
145
-
146
-
147
-
148
-
149
-
150
-
151
-
152
-
153
-
154
-
155
-
156
-
157
-
158
-
159
-
160
-
161
-
162
-
163
-
164
-
165
-
166
-
167
-
168
-
169
-
170
-
171
-
172
-
173
-
174
-
175
-
176
-
177
-
178
-
179
-
180
-
181
-
182
-
183
-
184
-
185
-
186
-
187
-
188
-
189
-
190
-
191
-
192
-
193
-
194
-
195
-
196
-
197
-
198
-
199
-
200
-
201
-
202
-
203
-
204
-
205
-
206
-
207
-
208
-
209
-
210
-
211
-
212
-
213
-
214
-
215
-
216
-
217
-
218
-
219
-
220
-
221
-
222
-
223
-
224
-
225
-
226
-
227
-
228
-
229
-
230
-
231
-
232
-
233
-
234
-
235
-
236
-
237
-
238
-
239
-
240
-
241
-
242
-
243
-
244
-
245
-
246
-
247
-
248
-
249
-
250
-
251
-
252
 |
 |

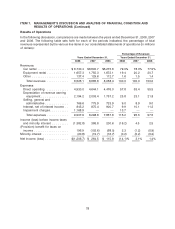
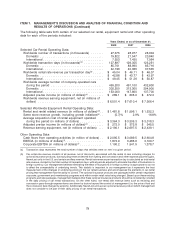
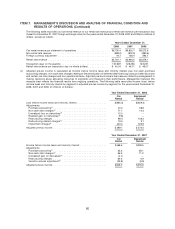
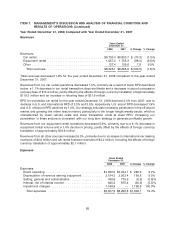
ITEM 7. MANAGEMENT’S DISCUSSION AND ANALYSIS OF FINANCIAL CONDITION AND
RESULTS OF OPERATIONS (Continued)
Year Ended December 31, 2006
Car Equipment
Rental Rental
Income before income taxes and minority interest ................ $373.5 $269.5
Adjustments:
Purchase accounting(1) ................................ 23.8 64.7
Non-cash debt charges(2) .............................. 75.0 11.3
Adjusted pre-tax income ................................ $472.3 $345.5
(1) Represents the purchase accounting effects of the Acquisition and any subsequent acquisitions on our results of
operations relating to increased depreciation and amortization of tangible and intangible assets and accretion of
revalued workers’ compensation and public liability and property damage liabilities.
(2) Represents non-cash debt charges relating to the amortization of deferred debt financing costs and debt discounts.
During the years ended December 31, 2008 and 2007, also includes $11.8 million and $20.4 million, respectively,
associated with the ineffectiveness of our Hertz Vehicle Financing LLC, or ‘‘HVF,’’ swaps. During the year ended
December 31, 2008, also includes $30.0 million related to the write-off of deferred financing costs associated with those
countries outside the United States as to which take-out asset-based facilities have not been entered into. During the
year ended December 31, 2007, also includes the write-off of $16.2 million of unamortized debt costs associated with a
debt modification. During the year ended December 31, 2006, also includes $1.0 million associated with the reversal of
the ineffectiveness of our HVF swaps.
(3) Represents unrealized and realized gains and losses on our interest rate swaptions.
(4) Represents incremental, one-time costs incurred directly supporting our business transformation initiatives. Such costs
include transition costs incurred in connection with our business process outsourcing arrangements and incremental
costs incurred to facilitate business process re-engineering initiatives that involve significant organization redesign and
extensive operational process changes.
(5) Represents non-cash impairment charges related to our goodwill, other intangible assets and property and equipment.
(6) Represents decreases in the employee vacation accrual relating to a change in our U.S. vacation policy in 2007 which
provides for vacation entitlement to be earned ratably throughout the year versus the previous policy which provided for
full vesting on January 1 each year.
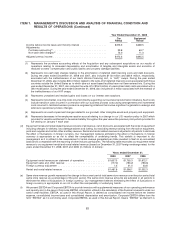
(d) Equipment rental and rental related revenue consists of all revenue, net of discounts, associated with the rental of equipment
including charges for delivery, loss damage waivers and fueling, but excluding revenue arising from the sale of equipment,
parts and supplies and certain other ancillary revenue. Rental and rental related revenue is adjusted in all periods to eliminate
the effect of fluctuations in foreign currency. Our management believes eliminating the effect of fluctuations in foreign
currency is appropriate so as not to affect the comparability of underlying trends. This statistic is important to our
management as it is utilized in the measurement of rental revenue generated per dollar invested in fleet on an annualized
basis and is comparable with the reporting of other industry participants. The following table reconciles our equipment rental
revenue to our equipment rental and rental related revenue (based on December 31, 2007 foreign exchange rates) for the
years ended December 31, 2008, 2007 and 2006 (in millions of dollars):
Years ended December 31,
2008 2007 2006
Equipment rental revenue per statement of operations ........... $1,657.3 $1,755.3 $1,672.1
Equipment sales and other revenue ....................... (177.0) (190.2) (193.6)
Foreign currency adjustment ............................ 1.5 31.0 53.8
Rental and rental related revenue ......................... $1,481.8 $1,596.1 $1,532.3
(e) Same store revenue growth represents the change in the current period total same store revenue over the prior period total
same store revenue as a percentage of the prior period. The same store revenue amounts are adjusted in all periods to
eliminate the effect of fluctuations in foreign currency. Our management believes eliminating the effect of fluctuations in
foreign currency is appropriate so as not to affect the comparability of underlying trends.
(f) We present EBITDA and Corporate EBITDA to provide investors with supplemental measures of our operating performance
and liquidity and, in the case of Corporate EBITDA, information utilized in the calculation of the financial covenants under our
senior credit facilities. EBITDA, as used in this Annual Report, is defined as consolidated net income before net interest
expense, consolidated income taxes and consolidated depreciation and amortization. Corporate EBITDA differs from the
term ‘‘EBITDA’’ as it is commonly used. Corporate EBITDA, as used in this Annual Report, means ‘‘EBITDA’’ as that term is
81