Hertz 2008 Annual Report Download - page 112
Download and view the complete annual report
Please find page 112 of the 2008 Hertz annual report below. You can navigate through the pages in the report by either clicking on the pages listed below, or by using the keyword search tool below to find specific information within the annual report.-
 1
1 -
2
-
3
-
4
-
5
-
6
-
7
-
8
-
9
-
10
-
11
-
12
-
13
-
14
-
15
-
16
-
17
-
18
-
19
-
20
-
21
-
22
-
23
-
24
-
25
-
26
-
27
-
28
-
29
-
30
-
31
-
32
-
33
-
34
-
35
-
36
-
37
-
38
-
39
-
40
-
41
-
42
-
43
-
44
-
45
-
46
-
47
-
48
-
49
-
50
-
51
-
52
-
53
-
54
-
55
-
56
-
57
-
58
-
59
-
60
-
61
-
62
-
63
-
64
-
65
-
66
-
67
-
68
-
69
-
70
-
71
-
72
-
73
-
74
-
75
-
76
-
77
-
78
-
79
-
80
-
81
-
82
-
83
-
84
-
85
-
86
-
87
-
88
-
89
-
90
-
91
-
92
-
93
-
94
-
95
-
96
-
97
-
98
-
99
-
100
-
101
-
 102
102 -
 103
103 -
 104
104 -
 105
105 -
 106
106 -
 107
107 -
 108
108 -
 109
109 -
 110
110 -
 111
111 -
 112
112 -
 113
113 -
 114
114 -
 115
115 -
 116
116 -
 117
117 -
 118
118 -
 119
119 -
 120
120 -
 121
121 -
 122
122 -
123
-
124
-
125
-
126
-
127
-
128
-
129
-
130
-
131
-
132
-
133
-
134
-
135
-
136
-
137
-
138
-
139
-
140
-
141
-
142
-
143
-
144
-
145
-
146
-
147
-
148
-
149
-
150
-
151
-
152
-
153
-
154
-
155
-
156
-
157
-
158
-
159
-
160
-
161
-
162
-
163
-
164
-
165
-
166
-
167
-
168
-
169
-
170
-
171
-
172
-
173
-
174
-
175
-
176
-
177
-
178
-
179
-
180
-
181
-
182
-
183
-
184
-
185
-
186
-
187
-
188
-
189
-
190
-
191
-
192
-
193
-
194
-
195
-
196
-
197
-
198
-
199
-
200
-
201
-
202
-
203
-
204
-
205
-
206
-
207
-
208
-
209
-
210
-
211
-
212
-
213
-
214
-
215
-
216
-
217
-
218
-
219
-
220
-
221
-
222
-
223
-
224
-
225
-
226
-
227
-
228
-
229
-
230
-
231
-
232
-
233
-
234
-
235
-
236
-
237
-
238
-
239
-
240
-
241
-
242
-
243
-
244
-
245
-
246
-
247
-
248
-
249
-
250
-
251
-
252
 |
 |
ITEM 7. MANAGEMENT’S DISCUSSION AND ANALYSIS OF FINANCIAL CONDITION AND
RESULTS OF OPERATIONS (Continued)
for the purchase of revenue earning vehicles and other specified uses under our Fleet Financing facilities
(defined below), our like-kind exchange programs and to satisfy certain of our self-insurance regulatory
reserve requirements. The increase in restricted cash of $70.3 million from December 31, 2007 to
December 31, 2008, primarily related to the timing of purchases and sales of revenue earning vehicles.
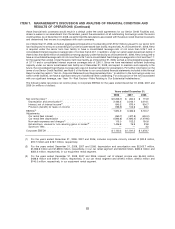
Our domestic and international operations are funded by cash provided by operating activities and by
extensive financing arrangements maintained by us in the United States, Europe, Puerto Rico, Australia,
New Zealand, Canada and Brazil. Net cash provided by operating activities during the year ended
December 31, 2008 was $2,095.5 million, a decrease of $994.0 million from the year ended
December 31, 2007. The decrease was primarily due to the current year net loss and decreases in the
year-over-year changes in receivables and accounts payable, partly offset by an increase in depreciation
of revenue earning equipment.
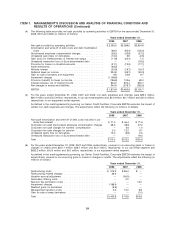
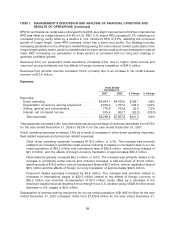
Our primary use of cash in investing activities is for the acquisition of revenue earning equipment, which
consists of cars and equipment. In addition, we and our affiliates may from time to time repurchase or
otherwise retire debt of our subsidiaries and take other steps to reduce such debt or otherwise improve
our balance sheet. These actions may include open market repurchases, negotiated repurchases and
other retirements of outstanding debt. The amount of debt that may be repurchased or otherwise retired,
if any, will depend on market conditions, trading levels of such debt from time to time, our cash position
and other considerations. Net cash used in investing activities during the year ended December 31,
2008 was $1,459.6 million, a decrease of $884.0 million from the year ended December 31, 2007. The
decrease is primarily due to a decrease in revenue earning equipment expenditures, partly offset by a
decrease in proceeds from the disposal of revenue earning equipment. For the year ended
December 31, 2008, our expenditures for revenue earning equipment were $10,024.2 million, partially
offset by proceeds from the disposal of such equipment of $8,846.1 million. These assets are purchased
by us in accordance with the terms of programs negotiated with the car and equipment manufacturers.
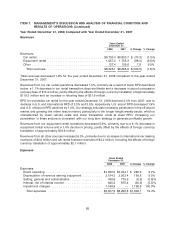
For the year ended December 31, 2008, our capital expenditures for property and non-revenue earning
equipment were $178.7 million and our proceeds from the disposal of such equipment were
$40.4 million. For the year ended December 31, 2008, net expenditures for revenue earning equipment
decreased as compared to 2007. This decrease was due to a decrease in year-over-year expenditures
for revenue earning equipment, partly offset by a year-over-year decrease in disposal proceeds relating
to revenue earning equipment. For the year ended December 31, 2008, net expenditures for property
and equipment were higher than our net expenditures in 2007 relating to a decrease in disposal
proceeds, partly offset by a decrease in year-over-year expenditures. For the full year 2009, we expect
the level of net expenditures for revenue earning equipment, property and non-revenue earning
equipment to be lower than the full year 2008. See ‘‘—Capital Expenditures’’ below.
Our car rental and equipment rental operations are seasonal businesses with decreased levels of
business in the winter months and typically heightened activity during the spring and summer. This is
particularly true of our airport car rental operations and our equipment rental operations. To
accommodate increased demand, we maintain a larger fleet by holding vehicles and equipment and
purchasing additional fleet which increases our financing requirements in the second and third quarters
of the year. These seasonal financing needs are funded by increasing the utilization of our various
corporate and fleet credit facilities and the variable funding notes portion of our U.S. Fleet Debt facilities.
As business demand moderates during the winter, we reduce our fleet accordingly and dispose of
vehicles and equipment. The disposal proceeds are used to reduce debt.
We are highly leveraged and a substantial portion of our liquidity needs arises from debt service on
indebtedness incurred in connection with the Transactions and from the funding of our costs of
92