Hertz 2008 Annual Report Download - page 187
Download and view the complete annual report
Please find page 187 of the 2008 Hertz annual report below. You can navigate through the pages in the report by either clicking on the pages listed below, or by using the keyword search tool below to find specific information within the annual report.-
 1
1 -
2
-
3
-
4
-
5
-
6
-
7
-
8
-
9
-
10
-
11
-
12
-
13
-
14
-
15
-
16
-
17
-
18
-
19
-
20
-
21
-
22
-
23
-
24
-
25
-
26
-
27
-
28
-
29
-
30
-
31
-
32
-
33
-
34
-
35
-
36
-
37
-
38
-
39
-
40
-
41
-
42
-
43
-
44
-
45
-
46
-
47
-
48
-
49
-
50
-
51
-
52
-
53
-
54
-
55
-
56
-
57
-
58
-
59
-
60
-
61
-
62
-
63
-
64
-
65
-
66
-
67
-
68
-
69
-
70
-
71
-
72
-
73
-
74
-
75
-
76
-
77
-
78
-
79
-
80
-
81
-
82
-
83
-
84
-
85
-
86
-
87
-
88
-
89
-
90
-
91
-
92
-
93
-
94
-
95
-
96
-
97
-
98
-
99
-
100
-
101
-
102
-
103
-
104
-
105
-
106
-
107
-
108
-
109
-
110
-
111
-
112
-
113
-
114
-
115
-
116
-
117
-
118
-
119
-
120
-
121
-
122
-
123
-
124
-
125
-
126
-
127
-
128
-
129
-
130
-
131
-
132
-
133
-
134
-
135
-
136
-
137
-
138
-
139
-
140
-
141
-
142
-
143
-
144
-
145
-
146
-
147
-
148
-
149
-
150
-
151
-
152
-
153
-
154
-
155
-
156
-
157
-
158
-
159
-
160
-
161
-
162
-
163
-
164
-
165
-
166
-
167
-
168
-
169
-
170
-
171
-
172
-
173
-
174
-
175
-
176
-
 177
177 -
 178
178 -
 179
179 -
 180
180 -
 181
181 -
 182
182 -
 183
183 -
 184
184 -
 185
185 -
 186
186 -
 187
187 -
 188
188 -
 189
189 -
 190
190 -
 191
191 -
 192
192 -
 193
193 -
 194
194 -
 195
195 -
 196
196 -
 197
197 -
198
-
199
-
200
-
201
-
202
-
203
-
204
-
205
-
206
-
207
-
208
-
209
-
210
-
211
-
212
-
213
-
214
-
215
-
216
-
217
-
218
-
219
-
220
-
221
-
222
-
223
-
224
-
225
-
226
-
227
-
228
-
229
-
230
-
231
-
232
-
233
-
234
-
235
-
236
-
237
-
238
-
239
-
240
-
241
-
242
-
243
-
244
-
245
-
246
-
247
-
248
-
249
-
250
-
251
-
252
 |
 |

HERTZ GLOBAL HOLDINGS, INC. AND SUBSIDIARIES
NOTES TO CONSOLIDATED FINANCIAL STATEMENTS (Continued)
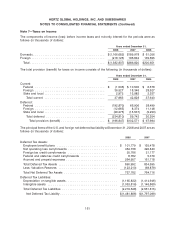
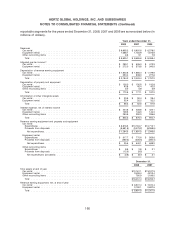
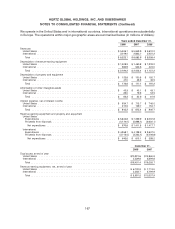
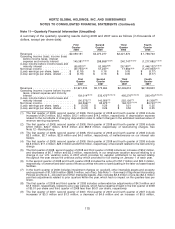
We operate in the United States and in international countries. International operations are substantially
in Europe. The operations within major geographic areas are summarized below (in millions of dollars):
Years ended December 31,
2008 2007 2006
Revenues
United States .............................................. $5,506.1 $ 5,849.9 $ 5,631.2
International ............................................... 3,019.0 2,835.7 2,427.2
Total .................................................. $8,525.1 $ 8,685.6 $ 8,058.4
Depreciation of revenue earning equipment
United States .............................................. $1,509.3 $ 1,460.8 $ 1,333.2
International ............................................... 684.9 542.6 424.0
Total .................................................. $2,194.2 $ 2,003.4 $ 1,757.2
Depreciation of property and equipment
United States .............................................. $ 125.8 $ 130.8 $ 150.7
International ............................................... 47.0 46.3 46.5
Total .................................................. $ 172.8 $ 177.1 $ 197.2
Amortization of other intangible assets
United States .............................................. $ 43.3 $ 43.1 $ 43.1
International ............................................... 23.0 19.5 18.5
Total .................................................. $ 66.3 $ 62.6 $ 61.6
Interest expense, net of interest income
United States .............................................. $ 634.7 $ 715.7 $ 746.0
International ............................................... 210.5 159.7 154.7
Total .................................................. $ 845.2 $ 875.4 $ 900.7
Revenue earning equipment and property and equipment
United States
Expenditures ............................................. $5,844.8 $ 7,399.9 $ 8,037.8
Proceeds from disposals ..................................... (5,174.0) (5,988.1) (6,620.1)
Net expenditures ......................................... $ 670.8 $ 1,411.8 $ 1,417.7
International
Expenditures ............................................. $4,358.1 $ 4,138.2 $ 3,607.0
Proceeds from disposals ..................................... (3,712.5) (3,325.1) (3,008.8)
Net expenditures ......................................... $ 645.6 $ 813.1 $ 598.2
December 31,
2008 2007
Total assets at end of year
United States ..................................................... $10,921.6 $12,860.9
International ...................................................... 5,529.8 6,394.8
Total .......................................................... $16,451.4 $19,255.7
Revenue earning equipment, net, at end of year
United States ..................................................... $6,132.8 $ 7,113.0
International ...................................................... 2,558.7 3,194.9
Total .......................................................... $8,691.5 $10,307.9
167