HTC 2008 Annual Report Download - page 98
Download and view the complete annual report
Please find page 98 of the 2008 HTC annual report below. You can navigate through the pages in the report by either clicking on the pages listed below, or by using the keyword search tool below to find specific information within the annual report.-
 1
1 -
2
-
3
-
4
-
5
-
6
-
7
-
8
-
9
-
10
-
11
-
12
-
13
-
14
-
15
-
16
-
17
-
18
-
19
-
20
-
21
-
22
-
23
-
24
-
25
-
26
-
27
-
28
-
29
-
30
-
31
-
32
-
33
-
34
-
35
-
36
-
37
-
38
-
39
-
40
-
41
-
42
-
43
-
44
-
45
-
46
-
47
-
48
-
49
-
50
-
51
-
52
-
53
-
54
-
55
-
56
-
57
-
58
-
59
-
60
-
61
-
62
-
63
-
64
-
65
-
66
-
67
-
68
-
69
-
70
-
71
-
72
-
73
-
74
-
75
-
76
-
77
-
78
-
79
-
80
-
81
-
82
-
83
-
84
-
85
-
86
-
87
-
 88
88 -
 89
89 -
 90
90 -
 91
91 -
 92
92 -
 93
93 -
 94
94 -
 95
95 -
 96
96 -
 97
97 -
 98
98 -
 99
99 -
 100
100 -
 101
101 -
 102
102 -
 103
103 -
 104
104 -
 105
105 -
 106
106 -
 107
107 -
 108
108 -
109
-
110
-
111
-
112
-
113
-
114
-
115
-
116
-
117
-
118
-
119
-
120
-
121
-
122
-
123
-
124
 |
 |

Financial Information
| 61
60 |
2008 Annual Report
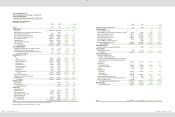
HTC CORPORATION
(Formerly High Tech Computer Corporation)
AND SUBSIDIARIES
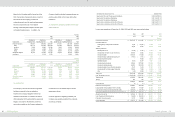
CONSOLIDATED STATEMENTS OF INCOME
YEARS ENDED DECEMBER 31, 2006, 2007 AND 2008
(In Thousands, Except Earnings Per Share)
2006
2007
2008
NT$
NT$
NT$
US$
(Note 3)
REVENUES (Notes 2 and 27)
$
105,358,397
$
118,217,545
$
152,353,176
$
4,644,914
COST OF REVENUES (Notes 4, 23 and 27)
74,053,697
77,773,277
101,362,538
3,090,321
GROSS PROFIT
31,304,700
40,444,268
50,990,638
1,554,593
OPERATING EXPENSES (Notes 23 and 27)
Selling and marketing
1,814,158
4,768,102
9,043,869
275,728
General and administrative
770,545
1,310,650
2,250,060
68,599
Research and development
2,974,003
3,705,261
9,351,439
285,105
Total operating expenses
5,558,706
9,784,013
20,645,368
629,432
OPERATING INCOME
25,745,994
30,660,255
30,345,270
925,161
NONOPERATING INCOME AND GAINS
Interest income
445,121
828,012
1,401,127
42,717
Gains on disposal of properties
39,111
77
4,521
138
Foreign exchange gain (Note 2)
626,464
707,642
632,969
19,298
Other
173,356
236,115
280,872
8,563
Total nonoperating income and gains
1,284,052
1,771,846
2,319,489
70,716
NONOPERATING EXPENSES AND LOSSES
Interest expense
298
1,212
10,441
319
Loss on equity-method investments (Notes 2 and 14)
-
-
6,151
188
Losses on disposal of properties
3,412
1,396
7,378
225
Valuation loss on financial instruments (Notes 2 and 6)
76,470
96,256
514,083
15,673
Other (Notes 18 and 27)
7,149
101,301
390,990
11,920
Total nonoperating expenses and losses
87,329
200,165
929,043
28,325
INCOME BEFORE INCOME TAX
26,942,717
32,231,936
31,735,716
967,552
INCOME TAX (Notes 2 and 24)
(
1,708,375
)
(
3,314,224
)
(
3,183,190
)
(
97,048
)
NET INCOME
$
25,234,342
$
28,917,712
$
28,552,526
$
870,504
ATTRIBUTABLE TO
Stockholders of the parent
$
25,247,327
$
28,938,862
$
28,635,349
$
873,029
Minority interest
(
12,985
)
(
21,150
)
(
82,823
)
(
2,525
)
$
25,234,342
$
28,917,712
$
28,552,526
$
870,504
(Continue)
2006
2007
2008
Before Income Tax
After Income Tax
Before Income Tax
After Income Tax
Before Income Tax
After Income Tax
NT$
NT$
NT$
NT$
NT$
US$
NT$
US$
(Note 3)
(Note 3)
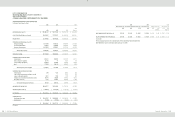
BASIC EARNINGS PER SHARE (Note 25)
$
35.39
$
33.15
$
42.55
$
38.30
$
41.89
$
1.28
$
37.97
$
1.16
DILUTED EARNINGS PER SHARE (Note 25)
$
35.08
$
32.85
$
42.55
$
38.30
$
40.42
$
1.23
$
36.64
$
1.12
(Concluded)
The accompanying notes are an integral part of the consolidated financial statements.
(With Deloitte & Touche audit report dated January 17, 2009)