HTC 2008 Annual Report Download - page 82
Download and view the complete annual report
Please find page 82 of the 2008 HTC annual report below. You can navigate through the pages in the report by either clicking on the pages listed below, or by using the keyword search tool below to find specific information within the annual report.-
 1
1 -
2
-
3
-
4
-
5
-
6
-
7
-
8
-
9
-
10
-
11
-
12
-
13
-
14
-
15
-
16
-
17
-
18
-
19
-
20
-
21
-
22
-
23
-
24
-
25
-
26
-
27
-
28
-
29
-
30
-
31
-
32
-
33
-
34
-
35
-
36
-
37
-
38
-
39
-
40
-
41
-
42
-
43
-
44
-
45
-
46
-
47
-
48
-
49
-
50
-
51
-
52
-
53
-
54
-
55
-
56
-
57
-
58
-
59
-
60
-
61
-
62
-
63
-
64
-
65
-
66
-
67
-
68
-
69
-
70
-
71
-
 72
72 -
 73
73 -
 74
74 -
 75
75 -
 76
76 -
 77
77 -
 78
78 -
 79
79 -
 80
80 -
 81
81 -
 82
82 -
 83
83 -
 84
84 -
 85
85 -
 86
86 -
 87
87 -
 88
88 -
 89
89 -
 90
90 -
 91
91 -
 92
92 -
93
-
94
-
95
-
96
-
97
-
98
-
99
-
100
-
101
-
102
-
103
-
104
-
105
-
106
-
107
-
108
-
109
-
110
-
111
-
112
-
113
-
114
-
115
-
116
-
117
-
118
-
119
-
120
-
121
-
122
-
123
-
124
 |
 |

Financial Information
| 29
28 |
2008 Annual Report
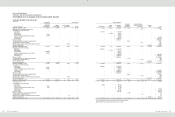
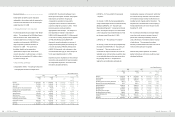
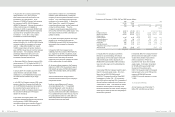
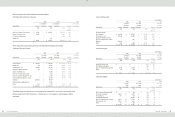
5.CASH
Cash as of December 31, 2006, 2007 and 2008 was as follows:
2006
2007
2008
NT$
NT$
NT$
US$
(Note 3)
Cash on hand
$
1,000
$
1,000
$
930
$
29
Cash in banks
4,137,988
8,776,552
1,774,195
54,091
Time deposits
30,258,400
46,258,680
60,051,748
1,830,846
$
34,397,388
$
55,036,232
$
61,826,873
$
1,884,966
On time deposits, interest rates ranged from 1.610% to 2.145%, 1.809% to 4.400% and 0.30% to 2.41%, as of
December 31, 2006, 2007 and 2008, respectively.
On preferential deposits, interest rates ranged from 2.30% to 5.25%, 3.05% to 4.15% and 0.02% to 2.71% as of
December 31, 2006, 2007 and 2008, respectively.
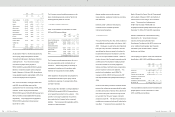
6.FINANCIAL ASSETS AND LIABILITIES AT FAIR VALUE THROUGH PROFIT OR LOSS
Financial assets and liabilities at fair value through profit or loss as of December 31, 2006, 2007 and 2008 were
as follows:
2006
2007
2008
NT$
NT$
NT$
US$
(Note 3)
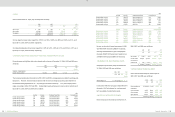
Derivatives - financial liabilities
Forward exchange contracts
$
76,470
$
96,256
$
514,083
$
15,673
The Company had derivative transactions in 2006, 2007 and 2008 to manage exposures related to exchange rate
fluctuations. However, these transactions did not meet the criteria for hedge accounting under Statement of
Financial Accounting Standards No. 34 - “Accounting for Financial Instruments.” Thus, the Company had no
hedge accounting in 2006, 2007 and 2008. Outstanding forward exchange and currency option contracts as of
December 31, 2006, 2007 and 2008 were as follows:
2006
Buy/Sell
Currency
Settlement Period/ Date
Contract Amount
Forward exchange contracts
Sell
USD/NTD
2007.01.05-2007.03.28
US$
78,000
Forward exchange contracts
Sell
EUR/USD
2007.01.05-2007.03.09
EUR€
108,000
Forward exchange contracts
Buy
USD/JPY
2007.01.12-2007.03.09
US$
11,000
Forward exchange contracts
Sell
GBP/USD
2007.01.05-2007.02.16
GBP£
6,150
Forward exchange contracts
Sell
JPY/NTD
2007.01.12-2007.03.28
JP¥
427,750
Forward exchange contracts
Sell
JPY/USD
2007.01.17-2007.03.28
JP¥
810,626
2007
Buy/Sell
Currency
Settlement Period/ Date
Contract Amount
Forward exchange contracts
Sell
USD/NTD
2008.01.04-2008.01.30
US$
63,000
Forward exchange contracts
Sell
EUR/USD
2008.01.09-2008.03.05
EUR
€
201,500
Forward exchange contracts
Buy
USD/CAD
2008.01.11-2008.02.22
US$
5,146
Forward exchange contracts
Sell
GBP/USD
2008.01.11-2008.01.30
GBP£
3,725
Forward exchange contracts
Sell
JPY/NTD
2008.01.09
JP¥
425,000
2008
Buy/Sell
Currency
Settlement Period/ Date
Contract Amount
Forward exchange contracts
Sell
AUD/USD
2009.01.07-2009.01.16
AUD$
17,000
Forward exchange contracts
Sell
EUR/USD
2009.01.07-2009.02.27
EUR€
141,000
Forward exchange contracts
Sell
GBP/USD
2009.01.07-2009.02.18
GBP£
3,870
Forward exchange contracts
Sell
JPY/NTD
2009.01.16
JP¥
95,000
Forward exchange contracts
Buy
USD/JPY
2009.01.07-2009.02.13
US$
16,726
Forward exchange contracts
Sell
USD/NTD
2009.01.07-2009.01.23
US$
37,000
Forward exchange contracts
Buy
USD/CAD
2009.01.16
US$
618
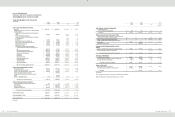
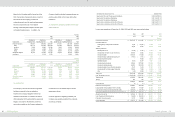
Net gain on derivative financial instruments in 2008
was NT$311,946 thousand (US$9,511 thousand),
including realized settlement gain of NT$826,029
thousand (US$25,184 thousand) and valuation loss
of NT$514,083 thousand (US$15,673 thousand).
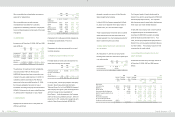
7.AVAILABLE-FOR-SALE FINANCIAL ASSETS
Available-for-sale financial assets as of December
31, 2006, 2007 and 2008 were as follows:
2006
2007
2008
NT$
NT$
NT$
US$
(Note 3)
VIA Technologies, Inc.
$
1,733
$
784
$
339
$
10
In December 1999, the Company invested NT$1,971
thousand in VIA Technologies, Inc. and accounted
for it as available-for-sale financial asset.
8.NOTES AND ACCOUNTS RECEIVABLE
Notes and accounts receivable as of December 31,
2006, 2007 and 2008 were as follows:
2006
2007
2008
NT$
NT$
NT$
US$
(Note 3)
Notes receivable
$
58,930
$
3,058
$
3,456
$
105
Accounts receivable
18,320,329
19,215,152
29,407,383
896,567
Less: Allowance for
doubtful accounts
(
2,350
)
(
271,285
)
(
550,597
)
(
16,787
)
$
18,376,909
$
18,946,925
$
28,860,242
$
879,885
9.OTHER CURRENT FINANCIAL ASSETS
Other current financial assets as of December 31,
2006, 2007 and 2008 were as follows:
2006
2007
2008
NT$
NT$
NT$
US$
(Note 3)
Other receivables from
related parties
$
130,990
$
171,901
$
13,869
$
423
Interest receivables
24,854
50,444
40,026
1,220
Other receivables
22,676
47,625
193,092
5,887
Agency payments
189,977
14,081
28,519
870
$
368,497
$
284,051
$
275,506
$
8,400