HTC 2008 Annual Report Download - page 74
Download and view the complete annual report
Please find page 74 of the 2008 HTC annual report below. You can navigate through the pages in the report by either clicking on the pages listed below, or by using the keyword search tool below to find specific information within the annual report.-
 1
1 -
2
-
3
-
4
-
5
-
6
-
7
-
8
-
9
-
10
-
11
-
12
-
13
-
14
-
15
-
16
-
17
-
18
-
19
-
20
-
21
-
22
-
23
-
24
-
25
-
26
-
27
-
28
-
29
-
30
-
31
-
32
-
33
-
34
-
35
-
36
-
37
-
38
-
39
-
40
-
41
-
42
-
43
-
44
-
45
-
46
-
47
-
48
-
49
-
50
-
51
-
52
-
53
-
54
-
55
-
56
-
57
-
58
-
59
-
60
-
61
-
62
-
63
-
 64
64 -
 65
65 -
 66
66 -
 67
67 -
 68
68 -
 69
69 -
 70
70 -
 71
71 -
 72
72 -
 73
73 -
 74
74 -
 75
75 -
 76
76 -
 77
77 -
 78
78 -
 79
79 -
 80
80 -
 81
81 -
 82
82 -
 83
83 -
 84
84 -
85
-
86
-
87
-
88
-
89
-
90
-
91
-
92
-
93
-
94
-
95
-
96
-
97
-
98
-
99
-
100
-
101
-
102
-
103
-
104
-
105
-
106
-
107
-
108
-
109
-
110
-
111
-
112
-
113
-
114
-
115
-
116
-
117
-
118
-
119
-
120
-
121
-
122
-
123
-
124
 |
 |

Financial Information
| 13
12 |
2008 Annual Report
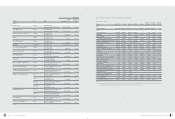
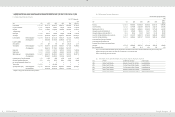
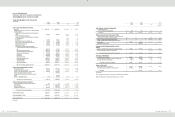
HTC CORPORATION
(Formerly High Tech Computer Corporation)
STATEMENTS OF INCOME
YEARS ENDED DECEMBER 31, 2006, 2007 AND 2008
(In Thousands, Except Earnings Per Share)
2006
2007
2008
NT$
NT$
NT$
US$
(Note 3)
REVENUES (Notes 2 and 25)
$
104,816,548
$
118,579,958
$
152,558,766
$
4,651,182
COST OF REVENUES (Notes 4, 21 and 25)
73,493,550
78,402,458
101,916,912
3,107,223
GROSS PROFIT
31,322,998
40,177,500
50,641,854
1,543,959
UNREALIZED PROFIT FROM INTERCOMPANY TRANSACTIONS
(
164,011
)
(
175,075
)
(
134,091
)
(
4,088
)
REALIZED PROFIT FROM INTERCOMPANY TRANSACTIONS
15,077
164,011
175,075
5,338
REALIZED GROSS PROFIT
31,174,064
40,166,436
50,682,838
1,545,209
OPERATING EXPENSES (Notes 21 and 25)
Selling and marketing
1,738,498
4,837,071
9,009,785
274,689
General and administrative
660,515
927,680
1,798,900
54,844
Research and development
2,954,427
3,866,148
9,617,768
293,225
Total operating expenses
5,353,440
9,630,899
20,426,453
622,758
OPERATING INCOME
25,820,624
30,535,537
30,256,385
922,451
NONOPERATING INCOME AND GAINS
Interest income
438,982
816,136
1,368,322
41,717
Gains on equity-method investments (Notes 2 and 14)
-
103,997
-
-
Gains on disposal of properties (Note 25)
41,361
2,120
5,631
172
Foreign exchange gain (Note 2)
603,127
658,247
660,765
20,145
Other
150,866
230,408
265,300
8,089
Total nonoperating income and gains
1,234,336
1,810,908
2,300,018
70,123
NONOPERATING EXPENSES AND LOSSES
Interest expense
298
241
232
7
Losses on equity-method investments (Notes 2 and 14)
12,554
-
57,289
1,747
Losses on disposal of properties
3,377
662
5,931
181
Valuation loss on financial instruments, net (Notes 2 and 6)
76,470
96,256
514,083
15,673
Other (Notes 17 and 25)
4,383
97,989
388,389
11,841
Total nonoperating expenses and losses
97,082
195,148
965,924
29,449
INCOME BEFORE INCOME TAX
26,957,878
32,151,297
31,590,479
963,125
INCOME TAX (Notes 2 and 22)
(
1,710,551
)
(
3,212,435
)
(
2,955,130
)
(
90,096
)
NET INCOME
$
25,247,327
$
28,938,862
$
28,635,349
$
873,029
(Continue)
2006
2007
2008
Before Income Tax
After Income Tax
Before Income Tax
After Income Tax
Before Income Tax
After Income Tax
NT$
NT$
NT$
NT$
NT$
US$
(Note 3)
NT$
US$
(Note 3)
BASIC EARNINGS PER SHARE (Note 23)
$
35.39
$
33.15
$
42.55
$
38.30
$
41.89
$
1.28
$
37.97
$
1.16
DILUTED EARNINGS PER SHARE (Note 23)
$
35.08
$
32.85
$
42.55
$
38.30
$
40.42
$
1.23
$
36.64
$
1.12
(Concluded)
The accompanying notes are an integral part of the financial statements.
(With Deloitte & Touche audit report dated January 17, 2009)