HTC 2008 Annual Report Download - page 116
Download and view the complete annual report
Please find page 116 of the 2008 HTC annual report below. You can navigate through the pages in the report by either clicking on the pages listed below, or by using the keyword search tool below to find specific information within the annual report.-
 1
1 -
2
-
3
-
4
-
5
-
6
-
7
-
8
-
9
-
10
-
11
-
12
-
13
-
14
-
15
-
16
-
17
-
18
-
19
-
20
-
21
-
22
-
23
-
24
-
25
-
26
-
27
-
28
-
29
-
30
-
31
-
32
-
33
-
34
-
35
-
36
-
37
-
38
-
39
-
40
-
41
-
42
-
43
-
44
-
45
-
46
-
47
-
48
-
49
-
50
-
51
-
52
-
53
-
54
-
55
-
56
-
57
-
58
-
59
-
60
-
61
-
62
-
63
-
64
-
65
-
66
-
67
-
68
-
69
-
70
-
71
-
72
-
73
-
74
-
75
-
76
-
77
-
78
-
79
-
80
-
81
-
82
-
83
-
84
-
85
-
86
-
87
-
88
-
89
-
90
-
91
-
92
-
93
-
94
-
95
-
96
-
97
-
98
-
99
-
100
-
101
-
102
-
103
-
104
-
105
-
 106
106 -
 107
107 -
 108
108 -
 109
109 -
 110
110 -
 111
111 -
 112
112 -
 113
113 -
 114
114 -
 115
115 -
 116
116 -
 117
117 -
 118
118 -
 119
119 -
 120
120 -
 121
121 -
 122
122 -
 123
123 -
 124
124
 |
 |

Financial Information
| 97
96 |
2008 Annual Report
For distribution of earnings generated on or after
January 1, 1998, the ratio for the imputation credits
allocated to stockholders of the Company is based
on the balance of the ICA as of the date of dividend
distribution. The expected creditable ratio for the
2008 earnings may be adjusted, depending on the
ICA balance on the date of dividend distribution.
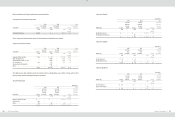
25.EARNINGS PER SHARE
Earnings per share (EPS) before tax and after tax
are calculated by dividing net income by the
weighted average number of common shares
outstanding which includes the deduction of the
effect of treasury stock during each year. The
weighted average number of shares used in EPS
calculation was 761,697 thousand shares, 755,608
thousand shares and 754,148 thousand shares for
the years ended December 31, 2006, 2007 and
2008, respectively. EPS for the years ended
December 31, 2006 and 2007 were calculated
after the average number of shares outstanding
was adjusted retroactively for the effect of stock
dividend distribution in 2008.
The Accounting Research and Development
Foundation issued Interpretation 2007-052 that
requires companies to recognize bonuses paid to
employees, directors and supervisors as
compensation expenses beginning January 1,
2008. These bonuses were previously recorded
as appropriations from earnings. If the Company
may settle the bonus to employees by cash or
shares, the Company should presume that the
entire amount of the bonus will be settled in shares
and the resulting potential shares should be
included in the weighted average number of
shares outstanding used in the calculation of
diluted EPS, if the shares have a dilutive effect.
The number of shares is estimated by dividing the
entire amount of the bonus by the closing price of
the shares at the balance sheet date. Such
dilutive effects of the potential shares needs to be
included in the calculation of diluted EPS until the
stockholders resolve the number of shares to be
distributed to employees at their meeting in the
following year. The related EPS information for
the years ended December 31, 2006, 2007 and
2008 are as follows:
2006
Numerators
Denominator
EPS (In Dollars)
Income before Income Tax
Income after Income Tax
Shares (Thousands)
Income before Income Tax
Income after Income Tax
NT$
NT$
NT$
NT$
Basic EPS
$
26,957,878
$
25,247,327
761,697
$
35.39
$
33.15
Employee stock options
-
-
6,763
Diluted EPS
$
26,957,878
$
25,247,327
768,460
$
35.08
$
32.85
2007
Numerators
Denominator
EPS (In Dollars)
Income before Income
Tax
Income after Income Tax
Shares (Thousands)
Income before Income
Tax
Income after Income Tax
NT$
NT$
NT$
NT$
Basic EPS
$
32,151,297
$
28,938,862
755,608
$
42.55
$
38.30
Employee stock
options
-
-
-
Diluted EPS
$
32,151,297
$
28,938,862
755,608
$
42.55
$
38.30
2008
Numerators
Denominator
EPS (In Dollars)
Income before Income Tax
Income after Income Tax
Shares (Thousands)
Income before Income Tax
Income after Income Tax
NT$
NT$
NT$
NT$
Basic EPS
$
31,590,479
$
28,635,349
754,148
$
41.89
$
37.97
Bonus to employees
-
-
27,400
Diluted EPS
$
31,590,479
$
28,635,349
781,548
$
40.42
$
36.64
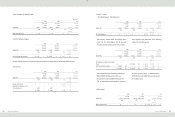
2008
Numerators
Denominator
EPS (In Dollars)
Income before Income Tax
Income after Income Tax
Shares (Thousands)
Income before Income Tax
Income after Income Tax
US$
US$
US$
US$
(Note 3)
(Note 3)
(Note 3)
(Note 3)
Basic EPS
$
963,125
$
873,029
754,148
$
1.28
$
1.16
Employees’ bonus
-
-
27,400
Diluted EPS
$963,125
$
873,029
781,548
$
1.23
$
1.12
26.FINANCIAL INSTRUMENTS
Fair Value of Financial Instruments
>Nonderivative Financial Instruments
December 31
2006
2007
2008
Carrying
Amount
Fair
Value
Carrying
Amount
Fair
Value
Carrying
Amount
Fair
Value
NT$
NT$
NT$
NT$
NT$
US$
NT$
US$
(Note 3)
(Note 3)
Assets
Available-for-sale financial assets -
noncurrent
$
1,733
$
1,733
$
784
$
784
$
339
$
10
$
339
$
10
Financial assets carried at cost
1,192
1,192
501,192
501,192
501,192
15,280
501,192
15,280
Bond investments not quoted in an
active market
-
-
33,030
33,030
-
-
-
-
Investments accounted for using
equity method
-
-
-
-
39,906
1,217
39,906
1,217