HTC 2008 Annual Report Download - page 73
Download and view the complete annual report
Please find page 73 of the 2008 HTC annual report below. You can navigate through the pages in the report by either clicking on the pages listed below, or by using the keyword search tool below to find specific information within the annual report.-
 1
1 -
2
-
3
-
4
-
5
-
6
-
7
-
8
-
9
-
10
-
11
-
12
-
13
-
14
-
15
-
16
-
17
-
18
-
19
-
20
-
21
-
22
-
23
-
24
-
25
-
26
-
27
-
28
-
29
-
30
-
31
-
32
-
33
-
34
-
35
-
36
-
37
-
38
-
39
-
40
-
41
-
42
-
43
-
44
-
45
-
46
-
47
-
48
-
49
-
50
-
51
-
52
-
53
-
54
-
55
-
56
-
57
-
58
-
59
-
60
-
61
-
62
-
 63
63 -
 64
64 -
 65
65 -
 66
66 -
 67
67 -
 68
68 -
 69
69 -
 70
70 -
 71
71 -
 72
72 -
 73
73 -
 74
74 -
 75
75 -
 76
76 -
 77
77 -
 78
78 -
 79
79 -
 80
80 -
 81
81 -
 82
82 -
 83
83 -
84
-
85
-
86
-
87
-
88
-
89
-
90
-
91
-
92
-
93
-
94
-
95
-
96
-
97
-
98
-
99
-
100
-
101
-
102
-
103
-
104
-
105
-
106
-
107
-
108
-
109
-
110
-
111
-
112
-
113
-
114
-
115
-
116
-
117
-
118
-
119
-
120
-
121
-
122
-
123
-
124
 |
 |
Financial Information
| 11
10 |
2008 Annual Report
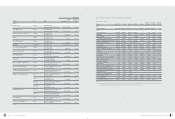
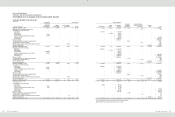
HTC CORPORATION
(Formerly High Tech Computer Corporation)
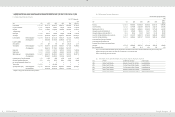
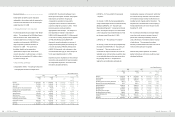
BALANCE SHEETS
DECEMBER 31, 2006, 2007 AND 2008
(In Thousands, Except Par Value)
2006
2007
2008
ASSETS
NT$
NT$
NT$
US$
(Note 3)
CURRENT ASSETS
Cash (Note 5)
$
34,397,388
$
55,036,232
$
61,826,873
$
1,884,966
Bond investments not quoted in an active market (Notes 2 and 13)
-
33,030
-
-
Notes receivable, net (Notes 2 and 8)
58,930
3,058
3,456
105
Accounts receivable, net (Notes 2 and 8)
18,317,979
18,943,867
28,856,786
879,780
Accounts receivable from related parties, net (Notes 2 and 25)
1,311,790
536,875
938,770
28,621
Other current financial assets (Notes 9 and 25)
368,497
284,051
275,506
8,400
Inventories (Notes 2, 4 and 10)
4,983,891
6,119,413
7,418,467
226,173
Prepayments (Notes 11 and 25)
1,881,119
1,537,327
1,237,631
37,733
Deferred income tax assets (Notes 2 and 22)
428,077
562,025
552,494
16,844
Other current assets
63,101
116,841
162,007
4,939
Total current assets
61,810,772
83,172,719
101,271,990
3,087,561
LONG-TERM INVESTMENTS
Available-for-sale financial assets - noncurrent (Notes 2 and 7)
1,733
784
339
10
Financial assets carried at cost (Notes 2 and 12)
1,192
501,192
501,192
15,280
Investments accounted for by the equity method (Notes 2 and 14)
559,877
2,397,133
4,342,704
132,400
Prepayments for long-term investments (Notes 2 and 14)
261,679
-
316,656
9,654
Total long-term investments
824,481
2,899,109
5,160,891
157,344
PROPERTIES
(Notes 2, 15 and 25)
Cost
Land
610,293
610,293
3,568,124
108,784
Buildings and structures
1,083,065
2,239,919
2,853,645
87,002
Machinery and equipment
2,913,495
3,336,489
3,927,100
119,729
Molding equipment
201,247
201,247
172,632
5,263
Computer equipment
180,855
212,623
264,248
8,056
Transportation equipment
1,938
1,335
2,732
83
Furniture and fixtures
105,016
115,696
127,202
3,878
Leased assets
4,712
4,712
4,712
144
Leasehold improvements
22,816
44,487
95,208
2,903
Total cost
5,123,437
6,766,801
11,015,603
335,842
Less: Accumulated depreciation
(
2,684,143
)
(
3,196,844
)
(
3,728,827
)
(
113,684
)
Prepayments for construction-in-progress and equipment-in-transit
470,330
145,944
88,875
2,709
Properties, net
2,909,624
3,715,901
7,375,651
224,867
OTHER ASSETS
Assets leased to others
-
-
309,959
9,450
Refundable deposits
36,991
93,437
117,464
3,582
Deferred charges (Note 2)
119,059
88,108
52,125
1,589
Deferred tax assets (Notes 2 and 22)
219,230
380,085
821,144
25,035
Other (Notes 2 and 18)
74,020
95,187
117,138
3,571
Total other assets
449,300
656,817
1,417,830
43,227
TOTAL
$
65,994,177
$
90,444,546
$
115,226,362
$
3,512,999
(Continue)
2006
2007
2008
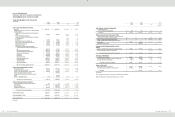
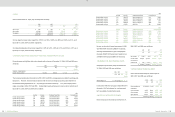
LIABILITIES AND STOCKHOLDERS’ EQUITY
NT$
NT$
NT$
US$
(Note 3)
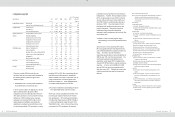
CURRENT LIABILITIES
Financial liabilities at fair value through profit or
loss (Notes 2, 6 and 24)
$
76,470
$
96,256
$
514,083
$
15,673
Notes and accounts payable (Note 25)
16,847,039
22,020,118
27,907,144
850,827
Income tax payable (Notes 2 and 22)
1,758,717
2,514,394
3,937,745
120,053
Accrued expenses (Notes 4, 16 and 25)
2,791,129
5,269,829
15,632,936
476,614
Payable for purchase of equipment
35,342
170,184
157,786
4,811
Other current liabilities (Notes 17 and 25)
1,912,622
4,297,358
6,408,776
195,390
Total current liabilities
23,421,319
34,368,139
54,558,470
1,663,368
OTHER LIABILITIES
Guarantee deposits received
640
628
6,406
195
Total liabilities
23,421,959
34,368,767
54,564,876
1,663,563
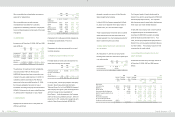
STOCKHOLDERS’ EQUITY
(Note 19)
Capital stock - NT$10.00 par value
Authorized: 1,000,000 thousand shares
Issued and outstanding: 436,419 thousand shares in
2006, 573,134 thousand shares in 2007 and 775,394
thousand shares in 2008
Common stock
4,364,192
5,731,337
7,553,938
230,303
Capital surplus
Additional paid-in capital
4,410,871
4,374,244
4,374,244
133,361
Long-term equity investments
15,845
15,845
17,534
535
Merger
25,972
25,756
25,756
785
Retained earnings
Legal reserve
1,991,520
4,516,253
7,410,139
225,919
Special reserve
6,175
-
-
-
Accumulated earnings
31,991,090
41,403,867
44,626,182
1,360,555
Cumulative translation adjustments (Note 2)
10,786
9,664
65,602
2,000
Unrealized valuation losses on financial instruments
(Notes 2 and 7)
(
238
)
(
1,187
)
(
1,632
)
(
50
)
Treasury stock (Notes 2 and 20)
(
243,995
)
-
(
3,410,277
)
(
103,972
)
Total stockholders’ equity
42,572,218
56,075,779
60,661,486
1,849,436
TOTAL
$
65,994,177
$
90,444,546
$
115,226,362
$
3,512,999
(Concluded)
The accompanying notes are an integral part of the financial statements.
(With Deloitte & Touche audit report dated January 17, 2009)