HTC 2008 Annual Report Download - page 70
Download and view the complete annual report
Please find page 70 of the 2008 HTC annual report below. You can navigate through the pages in the report by either clicking on the pages listed below, or by using the keyword search tool below to find specific information within the annual report.-
 1
1 -
2
-
3
-
4
-
5
-
6
-
7
-
8
-
9
-
10
-
11
-
12
-
13
-
14
-
15
-
16
-
17
-
18
-
19
-
20
-
21
-
22
-
23
-
24
-
25
-
26
-
27
-
28
-
29
-
30
-
31
-
32
-
33
-
34
-
35
-
36
-
37
-
38
-
39
-
40
-
41
-
42
-
43
-
44
-
45
-
46
-
47
-
48
-
49
-
50
-
51
-
52
-
53
-
54
-
55
-
56
-
57
-
58
-
59
-
 60
60 -
 61
61 -
 62
62 -
 63
63 -
 64
64 -
 65
65 -
 66
66 -
 67
67 -
 68
68 -
 69
69 -
 70
70 -
 71
71 -
 72
72 -
 73
73 -
 74
74 -
 75
75 -
 76
76 -
 77
77 -
 78
78 -
 79
79 -
 80
80 -
81
-
82
-
83
-
84
-
85
-
86
-
87
-
88
-
89
-
90
-
91
-
92
-
93
-
94
-
95
-
96
-
97
-
98
-
99
-
100
-
101
-
102
-
103
-
104
-
105
-
106
-
107
-
108
-
109
-
110
-
111
-
112
-
113
-
114
-
115
-
116
-
117
-
118
-
119
-
120
-
121
-
122
-
123
-
124
 |
 |

Financial Information
| 5
4 |
2008 Annual Report
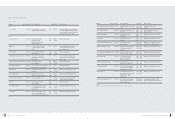
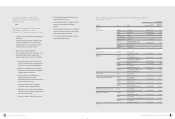
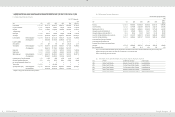
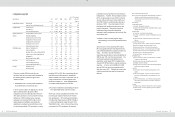
1. ABBREVIATED BALANCE SHEETS AND INCOME STATEMENTS FOR THE PAST FIVE FISCAL YEARS
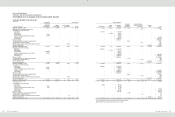
(1). Abbreviated Balance Sheets
Unit:NT$ thousands
Year
Item
2008
2007
2006
2005
2004
2009.3.31
Current Assets
101,271,990
83,172,719
61,810,772
36,616,174
19,391,836
97,795,810
Long-term Investments
5,160,891
2,899,109
824,481
325,533
352,000
5,496,185
Properties
7,375,651
3,715,901
2,909,624
2,495,256
2,518,942
8,357,197
Intangible Assets
0
0
0
0
0
0
Other Assets
1,417,830
656,817
449,300
484,309
278,298
1,379,725
Total Assets
115,226,362
90,444,546
65,994,177
39,921,272
22,541,076
113,028,917
Current Liabilities
Before Appropriation
54,558,470
34,368,139
23,421,319
16,935,170
9,421,405
47,386,909
After Appropriation
*
55,064,686
37,106,789
22,384,394
11,071,221
*
Long-term Liabilities
0
0
0
0
1,477,171
0
Other Liabilities
6,406
628
640
561
273,078
2,141
Total Liabilities
Before Appropriation
54,564,876
34,368,767
23,421,959
16,935,731
11,171,654
47,389,050
After Appropriation
*
55,065,314
37,107,429
22,384,955
12,821,470
*
Capital stock
7,553,938
5,731,337
4,364,192
3,570,160
2,763,114
7,453,938
Capital surplus
4,417,534
4,415,845
4,452,688
4,436,843
3,090,328
4,359,473
Retained Earnings
Before Appropriation
52,036,321
45,920,120
33,988,785
14,984,714
5,535,113
53,659,115
After Appropriation
*
23,400,972
18,899,930
8,741,458
3,202,770
*
Unrealized Loss On Financial Instruments
(1,632)
(1,187)
(238)
(1,135)
(1,268)
(1,147)
Cumulative Translation Adjustments
65,602
9,664
10,786
(5,041)
(17,865)
168,488
Net Loss Not Recognized As Pension Cost
0
0
0
0
0
0
Treasury Stock
(3,410,227)
0
(243,995)
0
0
0
Total Stockholders’ Equity
Before Appropriation
60,661,486
56,075,779
42,572,218
22,985,541
11,369,422
65,639,867
After Appropriation
*
35,379,232
28,886,748
17,536,317
9,719,606
*
Subject to change after shareholders’ meeting resolution
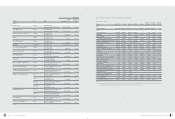
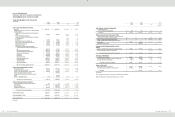
(2). Abbreviated Income Statements
NT$ thousands (Except EPS:NT$)
Year
Item
2008
2007
2006
2005
2004
2009Q1
(Note 2)
Revenues
152,558,766
118,579,958
104,816,548
72,768,522
36,397,166
31,590,366
Gross Profit (Note 1)
50,641,854
40,177,500
31,322,998
16,007,644
6,726,767
9,500,785
Operating Income (Note 1)
30,256,385
30,535,537
25,820,624
12,259,009
3,777,982
4,845,509
Non-operating Income and Gains (Note 1)
2,300,018
1,810,908
1,234,336
215,271
301,878
801,068
Non-operating Expenses and Losses (Note 1)
965,924
195,148
97,082
318,341
119,332
254,558
Income from Continuing Operations before Income Tax
31,590,479
32,151,297
26,957,878
12,155,939
3,960,528
5,392,019
Income from Continuing Operations
28,635,349
28,938,862
25,247,327
11,781,944
3,855,346
4,874,823
Income (Loss) from Discontinued Operations
-
-
-
-
-
-
Income (Loss) from Extraordinary Items
-
-
-
-
-
-
Cumulative Effect of Changes in Accounting Principle
-
-
-
-
-
-
Net Income
28,635,349
28,938,862
25,247,327
11,781,944
3,855,346
4,874,823
Basic Earnings Per Share
37.97
38.30
33.15
15.59
5.38
6.54
Note 1: In accordance with 2008 financial reporting requirements, write-downs of inventories or reversal of write-downs and product warranty costs
registered during the period 2004 to 2007 have been reclassified as cost of revenues items.
Note 2: Included employee bonus expenses
(3) . The Name of the Certified Public Accountant and the Auditor's Opinion
Year
CPA Firm
Certified Public Accountant
Auditor's Opinion
2004
Deloitte Touche Tohmatsu
Ming-Hsien Yang and Wen-Yea Shyu
Unqualified Opinion
2005
Deloitte Touche Tohmatsu
Tze-Chun Wang and Kwan-Chung Lai
Unqualified Opinion
2006
Deloitte Touche Tohmatsu
Tze-Chun Wang and Kwan-Chung Lai
Unqualified Opinion
2007
Deloitte Touche Tohmatsu
Ming-Hsien Yang and Kwan-Chung Lai
Unqualified Opinion
2008
Deloitte Touche Tohmatsu
Ming_Hsien Yang and Kwan-Chung Lai
Modified Unqualified Opinion