HTC 2008 Annual Report Download - page 76
Download and view the complete annual report
Please find page 76 of the 2008 HTC annual report below. You can navigate through the pages in the report by either clicking on the pages listed below, or by using the keyword search tool below to find specific information within the annual report.-
 1
1 -
2
-
3
-
4
-
5
-
6
-
7
-
8
-
9
-
10
-
11
-
12
-
13
-
14
-
15
-
16
-
17
-
18
-
19
-
20
-
21
-
22
-
23
-
24
-
25
-
26
-
27
-
28
-
29
-
30
-
31
-
32
-
33
-
34
-
35
-
36
-
37
-
38
-
39
-
40
-
41
-
42
-
43
-
44
-
45
-
46
-
47
-
48
-
49
-
50
-
51
-
52
-
53
-
54
-
55
-
56
-
57
-
58
-
59
-
60
-
61
-
62
-
63
-
64
-
65
-
 66
66 -
 67
67 -
 68
68 -
 69
69 -
 70
70 -
 71
71 -
 72
72 -
 73
73 -
 74
74 -
 75
75 -
 76
76 -
 77
77 -
 78
78 -
 79
79 -
 80
80 -
 81
81 -
 82
82 -
 83
83 -
 84
84 -
 85
85 -
 86
86 -
87
-
88
-
89
-
90
-
91
-
92
-
93
-
94
-
95
-
96
-
97
-
98
-
99
-
100
-
101
-
102
-
103
-
104
-
105
-
106
-
107
-
108
-
109
-
110
-
111
-
112
-
113
-
114
-
115
-
116
-
117
-
118
-
119
-
120
-
121
-
122
-
123
-
124
 |
 |

Financial Information
| 17
16 |
2008 Annual Report
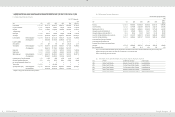
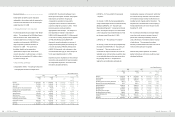
HTC CORPORATION
(Formerly High Tech Computer Corporation)
STATEMENTS OF CASH FLOWS
YEARS ENDED DECEMBER 31, 2006, 2007 AND 2008
(In Thousands)
2006
2007
2008
NT$
NT$
NT$
US$
(Note 3)
CASH FLOWS FROM OPERATING ACTIVITIES
Net income
$
25,247,327
$
28,938,862
$
28,635,349
$
873,029
Adjustments to reconcile net income to net cash provided by
operating activities
Depreciation (including depreciation of assets leased to
others)
601,382
525,055
568,208
17,323
Transfer of properties to expenses
-
-
18,059
551
Foreign exchange loss on bond investments not quoted
in an active market
-
-
2,670
81
Amortization
31,178
30,951
35,983
1,097
(Gain) loss on disposal of properties, net
(
37,984
)
(
1,458
)
300
9
Losses (gains) on equity-method investments
12,554
(
103,997
)
57,289
1,747
Deferred income tax assets
(
168,447
)
(
294,803
)
(
431,528
)
(
13,156
)
Prepaid pension costs
(
24,260
)
(
21,167
)
(
21,951
)
(
669
)
Net changes in operating assets and liabilities
Financial instruments at fair value through profit or
loss
136,555
19,786
417,827
12,739
Notes and accounts receivable
(
4,065,007
)
(
570,016
)
(
9,913,317
)
(
302,235
)
Accounts receivable from related parties
(
891,010
)
774,915
(
401,895
)
(
12,253
)
Other current financial assets
(
313,503
)
84,446
8,545
261
Inventories
(
146,338
)
(
1,135,522
)
(
1,299,054
)
(
39,605
)
Prepayments
(
1,406,858
)
343,792
299,696
9,137
Other current assets
(
32,776
)
(
53,740
)
(
45,166
)
(
1,377
)
Notes and accounts payable
3,050,346
5,173,079
5,887,026
179,482
Income tax payable
1,141,854
755,677
1,423,351
43,395
Accrued expenses
1,135,322
2,929,700
10,363,107
315,948
Other current liabilities
605,960
2,385,612
1,989,656
60,660
Net cash provided by operating activities
24,876,295
39,781,172
37,594,155
1,146,164
CASH FLOWS FROM INVESTING ACTIVITIES
Purchase of properties
(
997,233
)
(
1,201,063
)
(
4,577,491
)
(
139,558
)
Proceeds of the sales of properties
44,664
5,155
7,879
240
Increase in long-term investments - equity method
(
478,933
)
(
1,472,702
)
(
2,108,829
)
(
64,294
)
Increase in financial assets carried at cost
-
(
500,000
)
-
-
Purchase of bond investments not quoted in an active
market
-
(
33,030
)
-
-
Increase in refundable deposits
(
1,713
)
(
56,446
)
(
24,027
)
(
732
)
Net cash used in investing activities
(
1,433,215
)
(
3,258,086
)
(
6,702,468
)
(
204,344
)
CASH FLOWS FROM FINANCING ACTIVITIES
Increase (decrease) in guarantee deposits received
79
(
12
)
5,778
176
Cash dividends
(
4,998,224
)
(
11,685,470
)
(
19,486,547
)
(
594,102
)
Bonus to employees
-
(
2,451,000
)
(
1,210,000
)
(
36,890
)
Purchase of treasury stock
(
243,995
)
(
1,747,760
)
(
3,410,277
)
(
103,972
)
Net cash used in financing activities
(
5,242,140
)
(
15,884,242
)
(
24,101,046
)
(
734,788
)
NET INCREASE IN CASH
18,200,940
20,638,844
6,790,641
207,032
CASH, BEGINNING OF YEAR
16,196,448
34,397,388
55,036,232
1,677,934
CASH, END OF YEAR
$
34,397,388
$
55,036,232
$
61,826,873
$
1,884,966
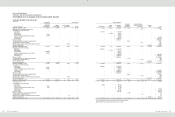
(Continue)
2006
2007
2008
NT$
NT$
NT$
US$
(Note 3)
SUPPLEMENTAL CASH FLOW INFORMATION
Cash paid during the year
Interest (net of amounts capitalized)
$
298
$
241
$
232
$
7
Income tax
$
737,145
$
2,751,561
$
1,963,307
$
59,857
NONCASH INVESTING AND FINANCING ACTIVITIES
Transfer of bond investment not quoted in an active market to
investments accounted for by the equity method
$
-
$
-
$
33,030
$
1,007
Transfer of properties to assets leased to others
$
-
$
-
$
309,959
$
9,450
Transfer of retained earnings and employee bonuses to
common stock
$
794,032
$
1,403,385
$
1,822,601
$
55,567
Retirement of treasury stock
$
-
$
1,991,755
$
-
$
-
INCREASE IN LONG-TERM INVESTMENTS - EQUITY
METHOD
Increase in investments accounted for by the equity method
$
478,933
$
1,472,702
$
2,231,529
68,035
Increase in payable for purchase of investments
-
-
(
122,700
)
(
3,741
)
Cash paid for increase in long-term investments
$
478,933
$
1,472,702
$
2,108,829
$
64,294
PURCHASE OF PROPERTIES
Cost of properties purchased
$
1,022,430
$
1,335,029
$
4,564,155
139,151
(Increase) decrease in payable for purchase of equipment
(
21,303
)
(
134,842
)
12,398
378
(Increase) decrease in lease payable
(
3,894
)
876
938
29
Cash paid for purchase of properties
$
997,233
$
1,201,063
$
4,577,491
$
139,558
BONUS TO EMPLOYEES
Appropriation of bonus to employees
$
451,000
$
2,000,000
$
1,210,000
36,890
(Increase) decrease in payable for employee bonus
(
451,000
)
451,000
-
-
Cash paid
$
-
$
2,451,000
$
1,210,000
$
36,890
(Concluded)
The accompanying notes are an integral part of the financial statements.
(With Deloitte & Touche audit report dated January 17, 2009)