HTC 2008 Annual Report Download - page 54
Download and view the complete annual report
Please find page 54 of the 2008 HTC annual report below. You can navigate through the pages in the report by either clicking on the pages listed below, or by using the keyword search tool below to find specific information within the annual report.-
 1
1 -
2
-
3
-
4
-
5
-
6
-
7
-
8
-
9
-
10
-
11
-
12
-
13
-
14
-
15
-
16
-
17
-
18
-
19
-
20
-
21
-
22
-
23
-
24
-
25
-
26
-
27
-
28
-
29
-
30
-
31
-
32
-
33
-
34
-
35
-
36
-
37
-
38
-
39
-
40
-
41
-
42
-
43
-
 44
44 -
 45
45 -
 46
46 -
 47
47 -
 48
48 -
 49
49 -
 50
50 -
 51
51 -
 52
52 -
 53
53 -
 54
54 -
 55
55 -
 56
56 -
 57
57 -
 58
58 -
 59
59 -
 60
60 -
 61
61 -
 62
62 -
 63
63 -
 64
64 -
65
-
66
-
67
-
68
-
69
-
70
-
71
-
72
-
73
-
74
-
75
-
76
-
77
-
78
-
79
-
80
-
81
-
82
-
83
-
84
-
85
-
86
-
87
-
88
-
89
-
90
-
91
-
92
-
93
-
94
-
95
-
96
-
97
-
98
-
99
-
100
-
101
-
102
-
103
-
104
-
105
-
106
-
107
-
108
-
109
-
110
-
111
-
112
-
113
-
114
-
115
-
116
-
117
-
118
-
119
-
120
-
121
-
122
-
123
-
124
 |
 |

VI. FIN AN CIAL STATUS, O PERATIN G RESULTS AN D RISK MAN AGEM EN T
103
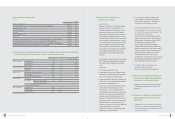
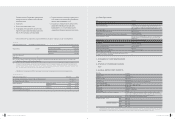
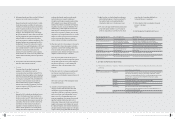
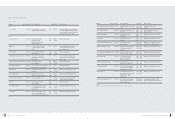
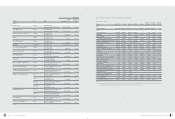
1. FINANCIAL STATUS
Unit : NT$ thousands
Difference
Item
2008 2007
Amount
%
Current Assets 101,271,990 83,172,719 18,099,271 22
Long-term Investments 5,160,891 2,899,109 2,261,782 78
Properties 7,375,651 3,715,901 3,659,750 98
Other Assets 1,417,830 656,817 761,013 116
Total Assets 115,226,362 90,444,546 24,781,816 27
Current Liabilities 54,558,470 34,368,139 20,190,331 59
Long-term Liabilities 0000
Other Liabilities 6,406 628 5,778 920
Total Liabilities 54,564,876 34,368,767 20,196,109 59
Capital Stock 7,553,938 5,731,337 1,822,601 32
Capital Surplus 4,417,534 4,415,845 1,689 0
Retained Earnings 52,036,321 45,920,120 6,116,201 13
Equity Adjustments 63,970 8,477 55,493 655
Treasury Stock ( 3,410,277) 0( 3,410,277) 0
Total Stockholders' Equity 60,661,486 56,075,779 4,585,707 8
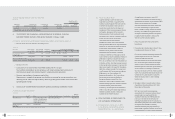
Explanations of the main reasons for and the impact of any material changes (a change from the previous period of 20 percent or more and amounting to at
least NT$10 million) in HTC's assets, liabilities, and shareholders' equity in the most recent two fiscal years, and the plan for related future measures.
1. Higher revenues and profits were main contributors to the increase in current assets recorded for the period; reflected in increases in bank deposits,
accounts receivables, and inventories.
2. Long-term investments rose for the period, primarily in response to production planning needs. HTC founded High Tech Computer Asia Pacific Pte.
Ltd. in order to register and establish HTC Electronics (Shanghai) Co. Ltd., the HTC subsidiary operation that is now responsible for manufacturing
converged phones and electronic components. HTC Investment Corporation, founded in 2008, is tasked with making strategic investments on behalf of
HTC Corporation.
3. The increase in properties for the period is principally due to the purchase of several tracts of land and buildings, slated for use in the development of
the HTC Campus and Taipei R&D Center.
4. The increase in other assets for the period is principally due to increases in deferred income tax assets resulting from increased product warranty
provision, accrued marketing costs, accrued licensing fees due to more revenues and shipments realized. Also, the purchase of production facilities
from Runtop Inc. provided HTC with leased assets which were previously leased by a third party for use of said facilities.
5. The increase in current liabilities for the period is principally due to a rise in non ODM business sales, reflected in increased accrued marketing costs
and accrued warranty liabilities necessary to enhance the perceived value and image of HTC products in the market. The reclassification of employee
bonus as expensed costs resulted in a new accrued expense item (employee bonus) of NT$6.2 billion at the end of year. The above resulted in an
increase in current liabilities of 59% over the previous fiscal year.
6. The increase in capital stock for the period is principally due to an unappropriated earnings and a capital stock increase due to employee bonuses.
7. The increase in equity adjustment is principally due to fluctuations in currency exchange rates and adjustments in long-term equity investments made
in order to reflect current currency exchange rates.
8. The increase in treasury stock is principally due to efforts made during the period to bolster company credit and shareholder interests through share
buybacks. All repurchased shares credited to treasury stock, 10 million shares in total, were formally eliminated on 2 February 2009.
102
2OO 8 HTC AN N UAL REPO RT
VI. FIN AN CIAL STATUS, O PERATIN G RESULTS
AN D RISK MAN AGEMEN T
'0 8A R_ HT C/ 英文版* NEW 05/ 21/ 20 09 11: 02 頁面 10 2