HTC 2008 Annual Report Download - page 88
Download and view the complete annual report
Please find page 88 of the 2008 HTC annual report below. You can navigate through the pages in the report by either clicking on the pages listed below, or by using the keyword search tool below to find specific information within the annual report.-
 1
1 -
2
-
3
-
4
-
5
-
6
-
7
-
8
-
9
-
10
-
11
-
12
-
13
-
14
-
15
-
16
-
17
-
18
-
19
-
20
-
21
-
22
-
23
-
24
-
25
-
26
-
27
-
28
-
29
-
30
-
31
-
32
-
33
-
34
-
35
-
36
-
37
-
38
-
39
-
40
-
41
-
42
-
43
-
44
-
45
-
46
-
47
-
48
-
49
-
50
-
51
-
52
-
53
-
54
-
55
-
56
-
57
-
58
-
59
-
60
-
61
-
62
-
63
-
64
-
65
-
66
-
67
-
68
-
69
-
70
-
71
-
72
-
73
-
74
-
75
-
76
-
77
-
 78
78 -
 79
79 -
 80
80 -
 81
81 -
 82
82 -
 83
83 -
 84
84 -
 85
85 -
 86
86 -
 87
87 -
 88
88 -
 89
89 -
 90
90 -
 91
91 -
 92
92 -
 93
93 -
 94
94 -
 95
95 -
 96
96 -
 97
97 -
 98
98 -
99
-
100
-
101
-
102
-
103
-
104
-
105
-
106
-
107
-
108
-
109
-
110
-
111
-
112
-
113
-
114
-
115
-
116
-
117
-
118
-
119
-
120
-
121
-
122
-
123
-
124
 |
 |

Financial Information
| 41
40 |
2008 Annual Report
Based on the Securities and Exchange Act of the
ROC, the number of reacquired shares should not
exceed 10% of the Company’s issued and
outstanding stocks, and the total purchase amount
should not exceed the sum of the retained
earnings, additional paid-in capital in excess of par,
and realized capital reserve. In addition, the
Company should not pledge its treasury shares nor
exercise voting rights on the shares before their
reissuance.
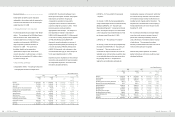
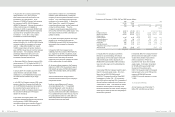
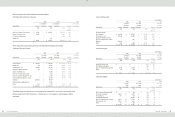
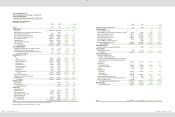
21.PERSONNEL EXPENSES, DEPRECIATION AND
AMORTIZATION
Function
Expense Item
2006
2007
NT$
NT$
Classified as
Operating Costs
Classified as
Operating Expenses
Total
Classified as
Operating Costs
Classified as
Operating Expenses
Total
Personnel expenses
1,399,381
1,980,666
3,380,047
1,511,827
2,357,008
3,868,835
Salary
1,167,170
1,736,364
2,903,534
1,261,420
2,029,616
3,291,036
Insurance
70,395
86,345
156,740
79,743
114,041
193,784
Pension
32,485
63,285
95,770
36,610
80,837
117,447
Others
129,331
94,672
224,003
134,054
132,514
266,568
Depreciation expense
367,879
233,503
601,382
279,752
245,303
525,055
Amortization
-
31,178
31,178
-
30,951
30,951
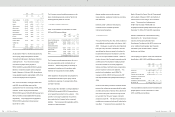
Function
Expense Item
2008
NT$
US$ (Note 3)
Classified as
Operating Costs
Classified as
Operating Expenses
Total
Classified as
Operating Costs
Classified as
Operating Expenses
Total
Personnel expenses
2,960,403
8,421,017
11,381,420
90,256
256,738
346,994
Salary
2,602,602
7,961,251
10,563,853
79,348
242,721
322,069
Insurance
123,335
147,065
270,400
3,760
4,484
8,244
Pension
48,583
114,880
163,463
1,481
3,502
4,983
Others
185,883
197,821
383,704
5,667
6,031
11,698
Depreciation expense
271,168
294,434
565,602
8,267
8,977
17,244
Amortization
-
35,983
35,983
-
1,097
1,097
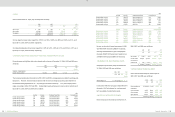
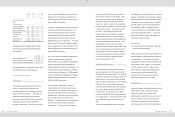
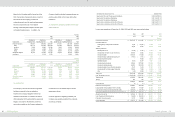
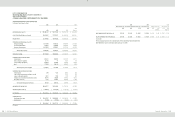
22.INCOME TAX
The Company’s income tax returns through 2003
had been examined by the tax authorities.
However, the Company disagreed with the tax
authorities’ assessment on its returns for 2001 to
2003 and applied for the administrative appeal and
litigation of its returns. Nevertheless, under the
conservatism guideline, the Company adjusted its
income tax for the tax shortfall stated in the tax
assessment notices.
Under the Statute for Upgrading Industries, the
Company was granted exemption from corporate
income tax as follows:
Item Exempt from Corporate Income Tax
Exemption Period
Sales of pocket PCs, pocket PCs (wireless) and Smartphones
2004.09.15-2009.09.14
Sales of pocket PCs (wireless) and Smartphones
2004.11.30-2009.11.29
Sales of pocket PCs (wireless) and Smartphones
2005.12.20-2010.12.19
Sales of wireless or smartphone which has 3G or GPS function
2006.12.20-2011.12.19
Sales of wireless or smartphone which has 3G or GPS function
2007.12.20-2012.12.19
Income taxes payable as of December 31, 2006, 2007 and 2008 were computed as follows:
2006
2007
2008
NT$
NT$
NT$
US$
(Note 3)
Income before income tax
$
26,957,878
$
32,151,297
$
31,590,479
$
963,125
Permanent differences
Losses (gains) on equity-method investments
12,554
(
103,997
)
57,289
1,747
Other
36,625
45,745
372,219
11,348
Temporary differences
Realized pension cost
(
24,260
)
(
21,166
)
(
21,951
)
(
669
)
Unrealized loss on decline in value of inventory
304,936
24,625
706,938
21,553
Unrealized royalties
1,930,164
271,000
2,104,308
64,155
Unrealized foreign exchange losses (gains), net
(
177,812
)
(
17,821
)
6,928
211
Unrealized bad debt expenses
-
64,603
180,011
5,488
Capitalized expense
(
19,414
)
30,767
74,251
2,264
Unrealized warranty expense
429,492
2,075,962
1,755,905
53,533
Unrealized marketing expenses
983,087
2,023,933
2,867,307
87,418
Unrealized valuation loss on financial instruments
76,470
19,786
417,827
12,739
Unrealized profit from intercompany transactions
148,934
11,064
(
40,984
)
(
1,250
)
Other
(
1,292
)
43,593
(
74,922
)
(
2,284
)
Total income
30,657,362
36,619,391
39,995,605
1,219,378
Less: Tax-exempt income tax
(
20,914,039
)
(
22,787,534
)
(
31,976,991
)
(
974,908
)
Taxable income
9,743,323
13,831,857
8,018,614
244,470
Tax rate
25%
25%
25%
25%
2,435,831
3,457,964
2,004,654
61,117
Income tax credit
(
10
)
(
10
)
(
10
)
-
Estimated income tax provision
2,435,821
3,457,954
2,004,644
61,117
Unappropriated earnings (additional 10% income tax)
436,049
571,507
352,583
10,749
Less: Investment research and development tax credits
(
1,024,576
)
(
648,134
)
(
352,583
)
(
10,749
)
Income tax payable determined pursuant to the Income Tax Law
$
1,847,294
$
3,381,327
$
2,004,644
$
61,117
Alternative minimum tax
$
1,847,294
$
3,381,327
$
3,396,417
$
103,549
Less: Prepaid and withheld income tax
(
156,308
)
(
1,060,575
)
(
438,747
)
(
13,376
)
Prior years’ income tax payable
67,731
193,642
980,075
29,880
Income tax payable
$
1,758,717
$
2,514,394
$
3,937,745
$
120,053