HTC 2008 Annual Report Download - page 71
Download and view the complete annual report
Please find page 71 of the 2008 HTC annual report below. You can navigate through the pages in the report by either clicking on the pages listed below, or by using the keyword search tool below to find specific information within the annual report.-
 1
1 -
2
-
3
-
4
-
5
-
6
-
7
-
8
-
9
-
10
-
11
-
12
-
13
-
14
-
15
-
16
-
17
-
18
-
19
-
20
-
21
-
22
-
23
-
24
-
25
-
26
-
27
-
28
-
29
-
30
-
31
-
32
-
33
-
34
-
35
-
36
-
37
-
38
-
39
-
40
-
41
-
42
-
43
-
44
-
45
-
46
-
47
-
48
-
49
-
50
-
51
-
52
-
53
-
54
-
55
-
56
-
57
-
58
-
59
-
60
-
 61
61 -
 62
62 -
 63
63 -
 64
64 -
 65
65 -
 66
66 -
 67
67 -
 68
68 -
 69
69 -
 70
70 -
 71
71 -
 72
72 -
 73
73 -
 74
74 -
 75
75 -
 76
76 -
 77
77 -
 78
78 -
 79
79 -
 80
80 -
 81
81 -
82
-
83
-
84
-
85
-
86
-
87
-
88
-
89
-
90
-
91
-
92
-
93
-
94
-
95
-
96
-
97
-
98
-
99
-
100
-
101
-
102
-
103
-
104
-
105
-
106
-
107
-
108
-
109
-
110
-
111
-
112
-
113
-
114
-
115
-
116
-
117
-
118
-
119
-
120
-
121
-
122
-
123
-
124
 |
 |
Financial Information
| 7
6 |
2008 Annual Report
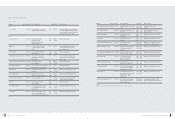
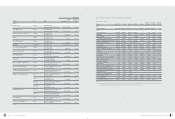
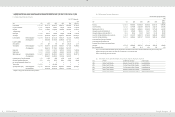
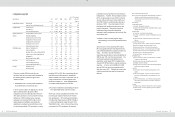
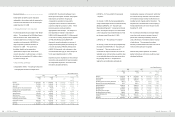
2. FINANCIAL ANALYSIS
Unit
:
NT$ thousands
Item (Note 2~3
2008
(Note 1)
2007
2006
2005
2004
2009.3.31
(Note 1)
Capital Structure Analysis
Debt Ratio (%)
47
38
35
42
50
42
Long-term Fund to Fixed Assets Ratio (%)
822
1,509
1,463
921
510
785
Liquidity Analysis
Current Ratio (%)
186
242
264
216
206
206
Quick Ratio (%)
169
218
233
183
157
189
Times Interest Earned (Times)
136,167
133,409
90,464
614
136
117,219
Operating Performance
Analysis
Average Collection Turnover (Times)
6.09
6.01
6.09
6.25
5.21
5.19
Days Sales Outstanding
60
61
60
58
70
70
Average Inventory Turnover (Times)
12.68
12.14
13.01
11.38
8.69
11.02
Average Payment Turnover (Times)
4.08
4.03
4.80
5.22
4.60
3.62
Average Inventory Turnover Days
29
30
28
32
42
33
Fixed Assets Turnover (Times)
20.68
31.91
36.02
29.16
14.45
15.12
Total Assets Turnover (Times)
1.32
1.31
1.59
1.82
1.61
1.12
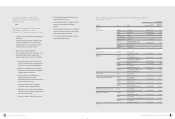
Profitability Analysis
Return on Total Assets (%)
28
37
48
38
20
17
Return on Equity (%)
49
59
77
69
41
31
Operating Income to Paid-in Capital Ratio (%)
401
533
592
343
137
65
Pre-tax Income to Paid-in Capital Ratio (%)
418
561
618
340
143
72
Net Margin (%)
19
24
24
16
11
15
Basic Earnings Per Share (NT$)
37.97
38.30
33.15
15.59
5.38
6.54
Cash Flow
Cash Flow Ratio (%)
69
116
106
75
31
24
Cash Flow Adequacy Ratio (%)
221
291
296
196
72
249
Cash Flow Reinvestment Ratio (%)
28
47
44
44
15
16
Leverage
Operating Leverage
1.44
1.20
1.16
1.26
1.70
1.66
Financial Leverage
1.00
1.00
1.00
1.00
1.01
1.00
Changes in certain 2008 financial ratios as
compared with previous years may be attributed to
the following factors present during the most
recent fiscal year:
1. Classification from 1 January 2008 of employee
bonus distributions as expensed costs
In terms of ratios noted in the table above, only the
ratio for 2008 has been adjusted to reflect
employee bonuses as expensed costs. Ratios for
other years continue to count such under earnings
distributions. 2008 employee bonus expenses
decreased net income by NT$5.6 billion, which
reduced apparent profitability accordingly. By
adjusting out employee bonus distributions, return
on total assets would be 33% and return on equity
would be 59% for 2008. Also, operating profit and
profit before tax would represent, respectively,
482% and 499% of the paid in capital ratio, the net
margin would be 22%, and earnings per share
would rise to NT$45.41. Such highlights further
the exceptional profit performance of HTC.
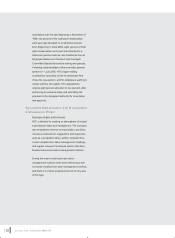
2. Purchase of multiple lots and buildings for future
HTC Taipei R&D Center and HTC Compus.
Working to enhance competitiveness further, HTC
is continuing to expand investments in research
and development. HTC purchased land located
in Xindian City, Taipei County for NT$3.335 billion
on which buildings will be raised to house HTC’s
Taipei R&D Center. Also, to improve the working
environment for HTC employees, the company
purchased various properties near to its Taoyuan
headquarters. Together, these purchases caused
HTC’s net fixed assets to rise to NT$7.4 billion at
the end of the current period; a rise of 98% over
the NT$3.7 billion in net fixed assets reported at
the close of 2007. Thus, the long-term fund to
fixed assets ratio and fixed assets turnover are
lower for the period. Payments for land and
building purchases have also reduced the
company’s cash flow adequacy ratio and cash flow
reinvestment ratio.
3. Growth in HTC non-ODM (original design
manufacturing) revenues during 2008 exceeded
40%
Since the launch of the proprietary HTC brand,
HTC has aggressively promoted brand business
and invested significantly to build brand value and
image. Such led to accrued marketing /
advertising expenditures and warranty liabilities for
2008 to grow 70% over the previous period. The
counting of employee bonus distributions as
expenditure costs caused HTC to register at the
close of 2008 NT$6.2 billion in new accrued bonus
expenses. As such, current liabilities for 2008
were up 59% over the previous period and the
debt ratio rose to 47%. Similarly, the current ratio,
quick ratio and cash flow ratio for the period all
declined.
Note 1: Included employee bonus expenses
Note 2: In accordance with 2008 financial reporting requirements, write-downs of
inventories or reversal of write-downs and product warranty costs
registered during the period 2004 to 2007 have been reclassified as cost
of revenues items.
Note 3: Glossary
a. Capital Structure Analysis
(1) Debt Ratio
=
Total Liabilities / Total Assets.
(2) Long-term Fund to Fixed Assets Ratio
=
(Shareholders' Equity + Long-term
Liabilities) / Net Fixed Assets.
b. Liquidity Analysis
(1) Current Ratio
=
Current Assets / Current Liabilities.
(2) Quick Ratio
=
(Current Assets - Inventories - Prepaid Expenses) / Current
Liabilities.
(3) Times Interest Earned
=
Earnings before Interest and Taxes / Interest
Expenses.
c. Operating Performance Analysis
(1) Average Collection Turnover
=
Net Sales / Average Trade Receivables.
(2) Days Sales Outstanding
=
365 / Average Collection Turnover.
(3) Average Inventory Turnover
=
Cost of Sales / Average Inventory.
(4) Average Payment Turnover
=
Cost of Sales / Average Trade Payables.
(5) Average Inventory Turnover Days
=
365 / Average Inventory Turnover.
(6) Fixed Assets Turnover
=
Net Sales / Net Fixed Assets.
(7) Total Assets Turnover
=
Net Sales / Total Assets.
d. Profitability Analysis
(1) Return on Total Assets
=
(Net Income + Interest Expenses * (1 - Effective
Tax Rate) ) / Average Total Assets.
(2) Return on Equity
=
Net Income / Average Shareholders' Equity.
(3) Net Margin
=
Net Income / Net Sales.
(4) Earnings Per Share
=
(Net Income - Preferred Stock Dividend) / Weighted
Average Number of Shares Outstanding.
e. Cash Flow
(1) Cash Flow Ratio
=
Net Cash Provided by Operating Activities / Current
Liabilities.
(2) Cash Flow Adequacy Ratio
=
Five-year Sum of Cash from Operations /
Five-year Sum of Capital Expenditures, Inventory Additions, and Cash
Dividend.
(3) Cash Flow Reinvestment Ratio
=
(Cash Provided by Operating Activities -
Cash Dividends) / (Gross Fixed Assets + Investments + Other Assets +
Working Capital).
f. Leverage
(1) Operating Leverage
=
(Net Sales - Variable Cost) / Income from Operations.
(2) Financial Leverage
=
Income from Operations / (Income from Operations –
Interest Expenses)