HTC 2008 Annual Report Download - page 55
Download and view the complete annual report
Please find page 55 of the 2008 HTC annual report below. You can navigate through the pages in the report by either clicking on the pages listed below, or by using the keyword search tool below to find specific information within the annual report.-
 1
1 -
2
-
3
-
4
-
5
-
6
-
7
-
8
-
9
-
10
-
11
-
12
-
13
-
14
-
15
-
16
-
17
-
18
-
19
-
20
-
21
-
22
-
23
-
24
-
25
-
26
-
27
-
28
-
29
-
30
-
31
-
32
-
33
-
34
-
35
-
36
-
37
-
38
-
39
-
40
-
41
-
42
-
43
-
44
-
 45
45 -
 46
46 -
 47
47 -
 48
48 -
 49
49 -
 50
50 -
 51
51 -
 52
52 -
 53
53 -
 54
54 -
 55
55 -
 56
56 -
 57
57 -
 58
58 -
 59
59 -
 60
60 -
 61
61 -
 62
62 -
 63
63 -
 64
64 -
 65
65 -
66
-
67
-
68
-
69
-
70
-
71
-
72
-
73
-
74
-
75
-
76
-
77
-
78
-
79
-
80
-
81
-
82
-
83
-
84
-
85
-
86
-
87
-
88
-
89
-
90
-
91
-
92
-
93
-
94
-
95
-
96
-
97
-
98
-
99
-
100
-
101
-
102
-
103
-
104
-
105
-
106
-
107
-
108
-
109
-
110
-
111
-
112
-
113
-
114
-
115
-
116
-
117
-
118
-
119
-
120
-
121
-
122
-
123
-
124
 |
 |

2OO 8 HTC AN N UAL REPO RT
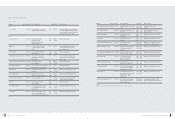
VI. FIN AN CIAL STATUS, O PERATIN G RESULTS AN D RISK MAN AGEM EN T
105
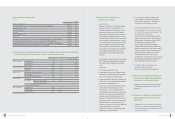
Unit: NT$1,000
Product Type Variance of gross Profit Variance Owing to Variance Owing to Variance Owing to Variance Owing to
in 2007 and 2006 Price Difference Cost Difference Product Mix Difference Quantity Difference
PDA
(
326,875
)
3,018 1,694
(
406,860
)
75,273
Smartphone ( 2,479,437) ( 664,075) 1,206,466 ( 4,221,800) 1,199,972
PDA Phone 13,637,241 ( 5,787,238) ( 2,215,232) 15,231,208 6,408,503
Subtotal 10,830,929 ( 6,448,295) ( 1,007,072) 10,602,548 7,683,748
Others ( 366,575)
Total 10,464,354
Explan
ation of variances:
1. Sales Price Variances: PDA products realized a positive sales price variance for the period due to higher average PDA prices supported by the
relatively smaller percentage of low-priced PDA models in the market. Smartphone and PDA Phone realized negative
sales price variances for the period due to efforts by HTC to promote its proprietary brand, resulting in an increase in
marketing subsidies and price supports that decreased average sales prices.
2. Cost Price Variances: A positive cost price variance was achieved for Smartphone products due to the reduced importance in this category of
ODM sales, which carry higher costs. PDA Phone products saw a negative cost price variance for the period due to
HTC
'
s launch of new models in the category, the costs of components and assembly for which are relatively high.
3. Sales Mix Variances: PDA Phone was the most important product group for HTC in terms of sales for the period. As such, its share of overall
sales grew, while products in other groups declined in overall importance. While the PDA Phone group realized a
positive sales mix variance for the period, HTC
'
s other two product groups saw a negative variance. The overall sales
mix variance for the period was positive.
4. Volume Variances: There was a slight increase in sales volume over the same time in the previous period. Extrapolation of a corresponding
increase in sales volume based on the sales mix proportions from the previous period resulted in a positive volume
variance.
The combined result of changes described above was an increase of NT$10,464,354 in gross
profit for the period.
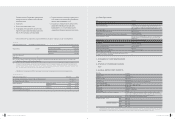
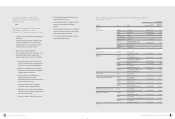
3. CASH FLOW
(1) Analysis of Change in Cash Flow for the Most Recent Fiscal Year
Unit: NT$1,000
Item
2008 2007
%
Cash Flow Ratio (%) 69 116 (41)
Cash Flow Adequacy Ratio (%) 221 291 (24)
Cash Flow Reinvestment Ratio (%) 28 47 (40)
Explanation and analysis of change in increase/decrease ratios:
1. The cash flow ratio for the period declined due to the reclassification of employee bonuses, an NT$6.2 billion allocation accrued, as an expensed cost.
Promotion of HTC's proprietary brand also resulted in a rise in accrued marketing expenses, warranty liabilities and other related current liabilities.
2. The cash flow adequacy ratio for the period declined. While cash flow from operations have risen steadily over the past five years, financial outlays this
period to purchase land and buildings necessary for the future HTC Campus and Taipei R&D Center resulted in significantly higher capital
expenditures. Also, the value of cash dividends paid out during the period (for fiscal year 2007) was somewhat higher than that of previous periods.
3. The cash reinvestment ratio declined for the period largely due to the purchase of land and buildings necessary for the future HTC Campus and Taipei
R& D Center. Said purchases served to greatly increase the value of gross fixed assets at the end of the period.
104
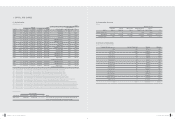
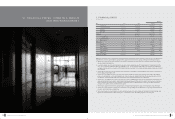
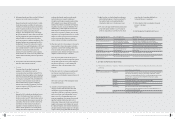
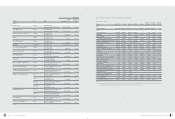
2. OPERATING RESULTS
(1). O perating Results: Comparative Analysis Table
Unit: NT$1,000
Year
Item
2008(note1) 2007(note2)
Difference %
Revenues 152,558,766 118,579,958 33,978,808 29
Cost of Revenues 101,916,912 78,402,458 23,514,454 30
Gross Profit 50,641,854 40,177,500 10,464,354 26
(Unrealized) Realized Profit From Intercompany Transactions 40,984 ( 11,064) 52,048 ( 470)
Realized Gross Profit 50,682,838 40,166,436 10,516,402 26
Operating Expenses 20,426,453 9,630,899 10,795,554 112
Operating Income 30,256,385 30,535,537 ( 279,152) ( 1)
Nonoperating Income and Gains 2,300,018 1,810,908 489,110 27
Nonoperating Expenses and Losses 965,924 195,148 770,776 395
Income From Continuing Operations Before Income Tax 31,590,479 32,151,297 ( 560,818) ( 2)
Income Tax ( 2,955,130) ( 3,212,435) 257,305 ( 8)
Income From Continuing Operations 28,635,349 28,938,862 ( 303,513) ( 1)
Note 1: Included employee bonus expenses
Note 2: In accordance with 2008 financial reporting, write-downs of inventories or reversal of write-downs and product warranty costs registered during the period 2004 to 2007 have
been reclassified as cost of revenue items.
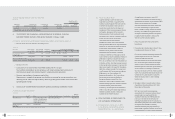
Analysis and explanation of the percentage of increase/decrease for the most recent two fiscal years (when the change in gross income is 20 percent or
more, a separate discrepancy analysis (Table 2) shall also be prepared):
1. Revenues, cost of revenues and gross profit are all up over the previous period. Rises may principally be attributed to HTC's regular introduction and
promotion of new products, such as those in the HTC Touch Diamond product line, which have sold well in the market. Revenues rose 29% for the
period, with operating costs and gross profit showing rises as well. Reclassification of employee bonuses as an expense item added NT$0.64 billion to
cost of revenues. Excluding the impact of employee bonus reclassification and exchange rate fluctuations, cost of revenues and gross profit grew at a
rate similar to that of revenues for the period.
2. Realized profit from intercompany transactions increased over the previous period due primarily to lower inventories of HTC products held by the
subsidiaries at the end of the accounting period.
3. The rise in operating expenses recorded over the previous reporting period is principally due to the recognition as of 2008 of employee bonus
expenses, totaling NT$5.49 billion, accrued as operating expenses. Excluding the impact of employee bonus expenses, the operating expenses grew
55% for the period. Also, investments are continuing to be targeted on product innovation, brand value enhancement and brand recognition, with
related expenses higher for the period than in the last.
4. Non-operating income and gains from such rose for the period primarily due to increased interest income arising from higher bank savings. HTC
engages in forward exchange transactions to minimize exposure to foreign currency exchange risks. The significant instability in forex markets during
the period resulted in attendant gains on foreign exchange transactions and losses in valuation, recorded, respectively as non-operating income and
non-operating expenses. In addition, non-operating expenses and losses rose for the period primarily due to the elevated financial risks posed by an
HTC customer, which in turn placed HTC at risk of being required to assume responsibility for payment to upstream suppliers of relevant costs of
goods already delivered to said customer of NT$260 million.
(2) Analysis of Change in Gross Income
Gross profit rose NT$10,464,354 thousand (26%) over the previous period. Principal reasons underpinning
the increase include variations in sales prices, cost prices, the sales mix, and sales volume for primary
product lines. Analysis and explanations of each follow below:
'0 8A R_ HT C/ 英文版* NEW 05/ 21/ 20 09 11: 02 頁面 10 4