HTC 2008 Annual Report Download - page 101
Download and view the complete annual report
Please find page 101 of the 2008 HTC annual report below. You can navigate through the pages in the report by either clicking on the pages listed below, or by using the keyword search tool below to find specific information within the annual report.-
 1
1 -
2
-
3
-
4
-
5
-
6
-
7
-
8
-
9
-
10
-
11
-
12
-
13
-
14
-
15
-
16
-
17
-
18
-
19
-
20
-
21
-
22
-
23
-
24
-
25
-
26
-
27
-
28
-
29
-
30
-
31
-
32
-
33
-
34
-
35
-
36
-
37
-
38
-
39
-
40
-
41
-
42
-
43
-
44
-
45
-
46
-
47
-
48
-
49
-
50
-
51
-
52
-
53
-
54
-
55
-
56
-
57
-
58
-
59
-
60
-
61
-
62
-
63
-
64
-
65
-
66
-
67
-
68
-
69
-
70
-
71
-
72
-
73
-
74
-
75
-
76
-
77
-
78
-
79
-
80
-
81
-
82
-
83
-
84
-
85
-
86
-
87
-
88
-
89
-
90
-
 91
91 -
 92
92 -
 93
93 -
 94
94 -
 95
95 -
 96
96 -
 97
97 -
 98
98 -
 99
99 -
 100
100 -
 101
101 -
 102
102 -
 103
103 -
 104
104 -
 105
105 -
 106
106 -
 107
107 -
 108
108 -
 109
109 -
 110
110 -
 111
111 -
112
-
113
-
114
-
115
-
116
-
117
-
118
-
119
-
120
-
121
-
122
-
123
-
124
 |
 |

Financial Information
| 67
66 |
2008 Annual Report
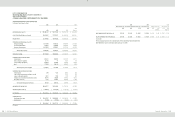
HTC CORPORATION
(Formerly High Tech Computer Corporation)
AND SUBSIDIARIES
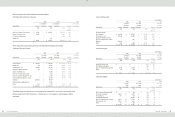
CONSOLIDATED STATEMENTS OF CASH FLOWS
YEARS ENDED DECEMBER 31, 2006, 2007 AND 2008
(In Thousands)
2006
2007
2008
NT$
NT$
NT$
US$ (Note 3)
CASH FLOWS FROM OPERATING ACTIVITIES
Net income
$
25,234,342
$
28,917,712
$
28,552,526
$
870,504
Adjustments to reconcile net income to net cash provided by operating activities
Depreciation (including depreciation of assets leased to others)
638,353
681,257
746,472
22,758
Transfer of properties to expenses
-
-
18,103
552
Foreign exchange loss on bond investments not quoted in an active market
-
-
2,670
81
Amortization
40,516
51,862
61,777
1,883
(Gain) loss on disposal of properties and deferred charges, net
(
35,699
)
1,319
2,857
87
Loss on equity-method investments
-
-
6,151
188
Deferred income tax assets
(
172,381
)
(
309,485
)
(
409,268
)
(
12,478
)
Prepaid pension cost
(
24,260
)
(
20,252
)
(
22,677)
)
(
691
)
Net changes in operating assets and liabilities
Financial instruments at fair value through profit or loss
136,555
19,786
418,356
12,755
Notes and accounts receivable
(
4,719,321
)
(
230,524
)
(
9,970,016
)
(
303,964
)
Other current financial assets
(
85,611
)
83,900
(
140,196
)
(
4,274
)
Inventories
(
645,482
)
(
1,273,718
)
(
1,013,635
)
(
30,904
)
Prepayments
(
1,449,856
)
304,116
282,622
8,617
Other current assets
(
192,527
)
(
63,149
)
17,947
547
Notes and accounts payable
3,199,690
5,918,175
5,366,753
163,621
Income tax payable
1,141,854
799,986
1,469,214
44,793
Accrued expenses
1,241,816
2,636,439
10,221,198
311,622
Other current liabilities
459,756
2,280,787
2,016,103
61,466
Net cash provided by operating activities
24,767,745
39,798,211
37,626,957
1,147,163
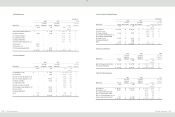
CASH FLOWS FROM INVESTING ACTIVITIES
Purchase of properties
(
1,166,408
)
(
1,424,307
)
(
5,639,163
)
(
171,926
)
Proceeds of the sales of properties and deferred charges
44,701
6,552
76,857
2,343
Increase in long-term investments - equity method
-
-
(
10,626
)
(
324
)
Increase in restricted assets
-
(
34,500
)
(
6,965
)
(
212
)
Increase in financial assets carried at cost
-
(
500,000
)
-
-
Purchase of bond investments not quoted in an active market
-
(
33,030
)
-
-
Acquisition of a subsidiary
-
(
240,039
)
(
6,297
)
(
192
)
Increase in refundable deposits
(
8,642
)
(
86,803
)
(
59,949
)
(
1,828
)
Increase in deferred charges
(
19,401
)
(
52,019
)
(
167,866
)
(
5,118
)
Net cash used in investing activities
(
1,149,750
)
(
2,364,146
)
(
5,814,009
)
(
177,257
)
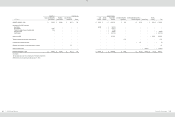
CASH FLOWS FROM FINANCING ACTIVITIES
Increase in short-term borrowings
-
-
75,000
2,287
Decrease in long-term bank loans
-
(
16,231
)
(
20,625
)
(
629
)
Increase (decrease) in guarantee deposits received
79
(
7
)
5,787
176
Cash dividends
(
4,998,224
)
(
11,685,470
)
(
19,486,547
)
(
594,102
)
Bonus to employees
-
(
2,451,000
)
(
1,210,000
)
(
36,890
)
Purchase of treasury stock
(
243,995
)
(
1,747,760
)
(
3,410,277
)
(
103,972
)
Increase in minority interest
161,499
-
-
-
Net cash used in financing activities
(
5,080,641
)
(
15,900,468
)
(
24,046,662
)
(
733,130
)
2006
2007
2008
NT$
NT$
NT$
US$ (Note 3)
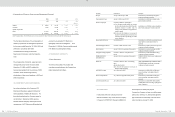
EFFECT OF EXCHANGE RATE CHANGES ON CASH AND CASH
EQUIVALENTS
$
7,238
$
(
13,230
)
$
(
18,743
)
$
(
571
)
NET INCREASE IN CASH AND CASH EQUIVALENTS
18,544,592
21,520,367
7,747,543
236,205
CASH AND CASH EQUIVALENTS, BEGINNING OF YEAR
16,425,226
34,969,818
56,490,185
1,722,262
CASH AND CASH EQUIVALENTS, END OF YEAR
$
34,969,818
$
56,490,185
$
64,237,728
$
1,958,467
SUPPLEMENTAL CASH FLOW INFORMATION
Cash paid during the year
Interest
$
298
$
1,212
$10,354
$
316
Income tax
$
738,902
$
2,823,723
$
2,111,548
$
64,376
NONCASH INVESTING AND FINANCING ACTIVITIES
Transfer of bond investment not quoted in an active market to
investments accounted for by the equity method
$
-
$
-
$
33,030
$
1,007
Transfer of properties to assets leased to others
$
-
$
-
$
309,959
9,450
Transfer of retained earnings and employee bonuses to common stock
$
794,032
$
1,403,385
$
1,822,601
$
55,567
Retirement of treasury stock
$
-
$
1,991,755
$
-
$
-
PURCHASE OF PROPERTIES
Cost of properties purchased
$
1,199,315
$
1,553,653
$
5,773,031
$
176,007
Increase in payable for purchase of equipment
(
29,013
)
(
130,222
)
(
134,806
)
(
4,110
)
(Increase) decrease in lease payable
(
3,894
)
876
938
29
Cash paid for purchase of properties
$
1,166,408
$
1,424,307
$
5,639,163
$
171,926
BONUS TO EMPLOYEES
Appropriation of bonus to employees
$
451,000
$
2,000,000
$
1,210,000
$
36,890
(Increase) decrease in payable for employee bonus
(
451,000
)
451,000
-
-
Cash paid
$
-
$
2,451,000
$
1,210,000
$
36,890
ACQUISITION OF A SUBSIDIARY
Expected net cash outflow on the acquisition of a subsidiary
$
-
$
240,039
$
128,997
$
3,933
Increase in other payable
-
-
(
122,700
)
(
3,741
)
Cash paid for acquisition of a subsidiary
$
-
$
240,039
$
6,297
$
192
(Concluded)
The accompanying notes are an integral part of the consolidated financial statements.
(With Deloitte & Touche audit report dated January 17, 2009)