HTC 2008 Annual Report Download - page 83
Download and view the complete annual report
Please find page 83 of the 2008 HTC annual report below. You can navigate through the pages in the report by either clicking on the pages listed below, or by using the keyword search tool below to find specific information within the annual report.-
 1
1 -
2
-
3
-
4
-
5
-
6
-
7
-
8
-
9
-
10
-
11
-
12
-
13
-
14
-
15
-
16
-
17
-
18
-
19
-
20
-
21
-
22
-
23
-
24
-
25
-
26
-
27
-
28
-
29
-
30
-
31
-
32
-
33
-
34
-
35
-
36
-
37
-
38
-
39
-
40
-
41
-
42
-
43
-
44
-
45
-
46
-
47
-
48
-
49
-
50
-
51
-
52
-
53
-
54
-
55
-
56
-
57
-
58
-
59
-
60
-
61
-
62
-
63
-
64
-
65
-
66
-
67
-
68
-
69
-
70
-
71
-
72
-
 73
73 -
 74
74 -
 75
75 -
 76
76 -
 77
77 -
 78
78 -
 79
79 -
 80
80 -
 81
81 -
 82
82 -
 83
83 -
 84
84 -
 85
85 -
 86
86 -
 87
87 -
 88
88 -
 89
89 -
 90
90 -
 91
91 -
 92
92 -
 93
93 -
94
-
95
-
96
-
97
-
98
-
99
-
100
-
101
-
102
-
103
-
104
-
105
-
106
-
107
-
108
-
109
-
110
-
111
-
112
-
113
-
114
-
115
-
116
-
117
-
118
-
119
-
120
-
121
-
122
-
123
-
124
 |
 |

Financial Information
| 31
30 |
2008 Annual Report
Other receivables from related parties were agency
payments for related parties.
Other receivables were primarily overseas
value-added tax receivables from customers,
prepayment for withholding income tax of employees’
bonus and travel expenses and proceeds of the sales
of properties.
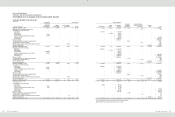
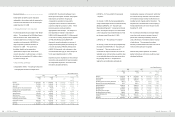
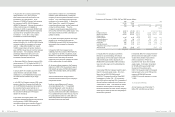
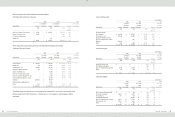
10.INVENTORIES
Inventories as of December 31, 2006, 2007 and 2008
were as follows:
2006
2007
2008
NT$
NT$
NT$
US$
(Note 3)
Finished goods
$
753,426
$
405,952
$
1,302,917
$
39,723
Work-in-process
1,207,886
1,641,460
2,435,581
74,255
Raw materials
3,914,242
4,988,289
5,303,195
161,683
5,875,554
7,035,701
9,041,693
275,661
Less: Valuation
allowance
(
891,663
)
(
916,288
)
(
1,623,226
)
(
49,488
)
$
4,983,891
$
6,119,413
$
7,418,467
$
226,173
The write-down of inventories to their net realizable
value amounted to NT$1,111,843 thousand
(US$33,898 thousand) and was recognized as cost
of sales for the year ended December 31, 2008. For
consistency with the presentation of the financial
statements for the year ended December 31, 2008,
the Company reclassified “provision for loss on
inventories” amounting to NT$729,310 thousand and
NT$487,479 thousand for the years ended December
31, 2006 and 2007, respectively, to “cost of sales.”
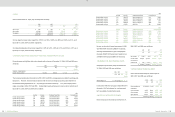
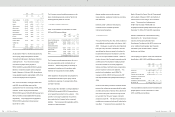
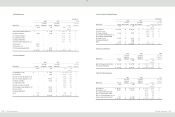
11.PREPAYMENTS
Prepayments as of December 31, 2006, 2007 and
2008 were as follows:
2006
2007
2008
NT$
NT$
NT$
US$
(Note 3)
Royalty
$
1,631,513
$
1,232,901
$
976,824
$
29,781
Software and
hardware maintenance
80,517
76,732
73,218
2,232
Service
50,606
32,241
89,181
2,719
Travel
47,298
6,542
3,601
110
Molding equipment
40,088
158,280
80,420
2,452
Materials purchases
1,479
1,838
2,875
88
Others
29,618
28,793
11,512
351
$
1,881,119
$
1,537,327
$
1,237,631
$
37,733
Prepayments for royalty were primarily prepayments
for discount purposes (Note 27 has more
information).
Prepayments for others were primarily for rent and
insurance expenses.
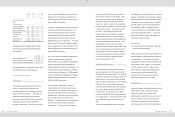
12.FINANCIAL ASSETS CARRIED AT COST
Financial assets carried at cost as of December 31,
2006, 2007 and 2008 were as follows:
2006
2007
2008
NT$
NT$
NT$
US$
(Note 3)
Hua-Chuang Automobile
Information Technical Center
Co., Ltd.
$
-
$
500,000
$
500,000
$
15,244
Answer Online, Inc.
1,192
1,192
1,192
36
$
1,192
$
501,192
$
501,192
$
15,280
In January 2007, the Company acquired 10% equity
interest in Hua-Chuang Automobile Information
Technical Center Co., Ltd. for NT$500,000 thousand.
The Company also signed a joint venture agreement
with Yulon Group, the main stockholder of
Hua-Chuang. Under the agreement, the Company
and Yulon Group may, between January 1, 2010 and
December 31, 2011, submit written requests to each
other for Yulon Group to buy back NT$300,000
thousand at original price, some of Hua-Chuang’s
shares bought by the Company.
In March 2004, the Company merged with IA Style,
Inc. (Note 1) and acquired 1.82% equity interest in
Answer Online, Inc. as a result of the merger.
These unquoted equity instruments were not carried
at fair value because their fair value could not be
reliably measured; thus, the Company accounted for
these investments by the cost method.
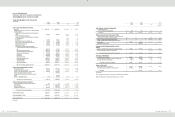
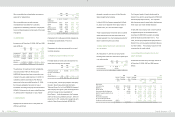
13.BOND INVESTMENTS NOT QUOTED IN AN
ACTIVE MARKET
As of December 31, 2007 the Company had the
following bond investment, which had no quoted price
in an active market:
2007
2007
2008
NT$
NT$
NT$
US$
(Note 3)
Bond investment
$
-
$
33,030
$
-
$
-
Less: Current portion
-
(
33,030
)
-
-
$
-
$
-
$
-
$
-
The Company bought 12-month bond issued by
Vitamin D Inc. with 6% annual interest for NT$33,030
thousand (US$1,000 thousand). The unquoted
debt instrument was not carried at fair value because
its fair value could not be reliably measured.
In April 2008, the Company made a new investment
of US$350 thousand and transferred its bond
investment of US$1,000 thousand to convertible
preferred stocks issued by Vitamin D Inc. As a
result, the Company acquired 27% equity interest in
Vitamin D Inc. and can exercise significant influence
over this investee. The Company accounts for this
investment by the equity method.
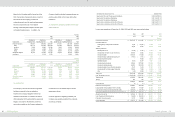
14.INVESTMENTS ACCOUNTED FOR BY THE
EQUITY METHOD
Investments accounted for by the equity method as
of December 31, 2006, 2007 and 2008 were as
follows:
2006
2007
2008
Carrying
Value
Ownership
Percentage
Carrying
Value
Ownership
Percentage
Original Cost
Carrying Value
Ownership
Percentage
NT$
NT$
NT$
US$
NT$
US$
(Note 3)
(Note 3)
Equity method
H.T.C. (B.V.I.) Corp.
$
422,788
100
$
1,427,492
100
$
1,543,906
$
47,070
$
1,557,022
$
47,470
100
BandRich Inc.
136,200
51
114,487
51
135,000
4,116
29,460
898
51
HTC HK, Limited
889
100
8,034
100
1,277
39
46,743
1,425
100
Communication Global Certification Inc.
-
-
281,621
100
280,000
8,537
273,583
8,341
100
High Tech Computer Asia Pacific Pte. Ltd.
-
-
565,499
100
2,023,774
61,700
2,094,922
63,870
100
Vitamin D Inc.
-
-
-
-
40,986
1,250
39,906
1,217
26
HTC Investment Corporation
-
-
-
-
300,000
9,146
301,006
9,177
100
PT. High Tech Computer Indonesia
-
-
-
-
62
2
62
2
1
Prepayments for long-term investments
261,679
-
-
-
316,656
9,654
316,656
9,654
-
$
821,556
$
2,397,133
$
4,641,661
$
141,514
$
4,659,360
$
142,054