HTC 2008 Annual Report Download - page 92
Download and view the complete annual report
Please find page 92 of the 2008 HTC annual report below. You can navigate through the pages in the report by either clicking on the pages listed below, or by using the keyword search tool below to find specific information within the annual report.-
 1
1 -
2
-
3
-
4
-
5
-
6
-
7
-
8
-
9
-
10
-
11
-
12
-
13
-
14
-
15
-
16
-
17
-
18
-
19
-
20
-
21
-
22
-
23
-
24
-
25
-
26
-
27
-
28
-
29
-
30
-
31
-
32
-
33
-
34
-
35
-
36
-
37
-
38
-
39
-
40
-
41
-
42
-
43
-
44
-
45
-
46
-
47
-
48
-
49
-
50
-
51
-
52
-
53
-
54
-
55
-
56
-
57
-
58
-
59
-
60
-
61
-
62
-
63
-
64
-
65
-
66
-
67
-
68
-
69
-
70
-
71
-
72
-
73
-
74
-
75
-
76
-
77
-
78
-
79
-
80
-
81
-
 82
82 -
 83
83 -
 84
84 -
 85
85 -
 86
86 -
 87
87 -
 88
88 -
 89
89 -
 90
90 -
 91
91 -
 92
92 -
 93
93 -
 94
94 -
 95
95 -
 96
96 -
 97
97 -
 98
98 -
 99
99 -
 100
100 -
 101
101 -
 102
102 -
103
-
104
-
105
-
106
-
107
-
108
-
109
-
110
-
111
-
112
-
113
-
114
-
115
-
116
-
117
-
118
-
119
-
120
-
121
-
122
-
123
-
124
 |
 |

Financial Information
| 49
48 |
2008 Annual Report
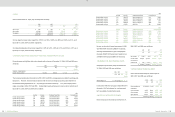
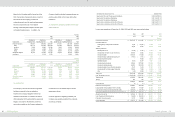
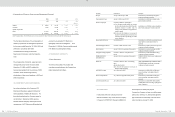
Major transactions with related parties are summarized below:
>Purchases of Inventories and Services
2006
2007
2008
Related Party
Amount
% to Total Net
Purchases
Amount
% to Total Net
Purchases
Amount
% to Total Net
Purchases
NT$
NT$
NT$
US$
(Note 3)
High Tech Computer Corp. (Suzhou)
$
16,069
-
$
160,399
-
$
167,775
$
5,115
-
Chander Electronics Corp.
72,290
-
-
-
19,041
581
-
HTC Electronics (Shanghai)
-
-
-
-
13,975
426
-
BandRich Inc.
-
-
104
-
-
-
-
$
88,359
-
$
160,503
-
$
200,791
$
6,122
-
Terms of payment and purchasing prices for both related and third parties were similar.
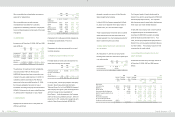
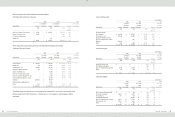
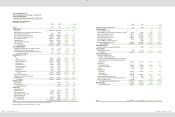
>Sales and Services Provided
2006
2007
2008
Related Party
Amount
% to Total
Revenues
Amount
% to Total
Revenues
Amount
% to Total
Revenues
NT$
NT$
NT$
US$
(Note 3)
HTC America Inc.
$
953,579
1
$
1,094,791
1
$
1,524,385
$
46,475
2
BandRich Inc.
396
-
116,693
-
266,166
8,115
-
HTC Europe Co., Ltd.
389,302
-
687,451
1
198,346
6,047
-
Employees’ Welfare Committee
228
-
212
-
101,195
3,085
-
Xander International Corp.
-
-
39,893
-
93,923
2,864
-
High Tech Computer (H.K.) Limited
-
-
3,350
-
78,703
2,399
-
High Tech Computer Singapore Pte. Ltd.
-
-
3,707
-
59,422
1,812
-
First International Computer, Inc. (FIC)
-
-
55,408
-
24,222
738
-
Exedea Inc.
2,080,052
2
191,897
-
-
-
-
Comserve Network Netherlands B.V.
-
-
37,587
-
-
-
-
Others
1,533
-
3,712
-
17,375
530
-
$
3,425,090
3
$
2,234,701
2
$
2,363,737
$
72,065
2
The selling prices and collection terms for products sold to related parties were similar to those sold to third
parties, except those for HTC America Inc., HTC Europe Co., Ltd., Exedea Inc. and Employees’ Welfare
Committee.
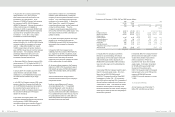
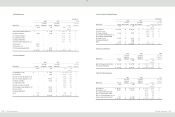
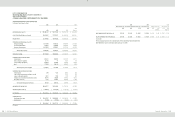
>Accounts Receivable
December 31
2006
2007
2008
Related Party
Amount
% to Total
Accounts
Receivable
Amount
% to Total
Accounts
Receivable
Amount
% to Total
Accounts
Receivable
NT$
NT$
NT$
US$
(Note 3)
Accounts receivable
HTC America Inc.
$
444,099
2
$
273,472
2
$
761,193
$
23,207
3
HTC Europe Co., Ltd.
263,376
1
248,903
1
81,917
2,497
-
Employees’ Welfare Committee.
-
-
-
-
69,238
2,111
-
High Tech Computer (H.K.) Limited
-
-
3,201
-
9,893
302
-
Exedea Inc.
603,021
3
-
-
-
-
-
Others
1,294
-
11,299
-
16,529
504
-
$
1,311,790
6
$
536,875
3
$
938,770
$
28,621
3
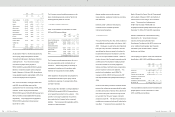
>Accounts Payable
December 31
2006
2007
2008
Related Party
Amount
% to Total
Accounts
Payable
Amount
% to Total
Accounts
Payable
Amount
% to Total
Accounts
Payable
NT$
NT$
NT$
US$
(Note 3)
Chander Electronics Corp.
$
-
-
$
-
-
$
19,041
$
581
-
HTC Electronics (Shanghai)
-
-
-
-
7,626
232
-
High Tech Computer Corp. (Suzhou)
13,560
-
28,386
-
1,427
43
-
Others
494
-
1,015
-
609
19
-
$
14,054
-
$
29,401
-
$
28,703
$
875
-
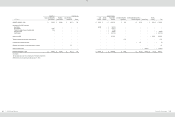
>Other Receivables
December 31
2006
2007
2008
Related Party
Amount
% to Total
Other
Receivables
Amount
% to Total
Other
Receivable
Amount
% to Total
Other
Receivables
NT$
NT$
NT$
US$
(Note 3)
HTC Corporation (Shanghai WGQ)
$
-
-
$
342
-
$
6,064
$
185
3
HTC Nippon Corporation
27,249
18
16,917
8
1,815
56
1
HTC America Inc.
377
-
810
-
1,666
51
1
HTC Belgium BVBA/SPRL
-
-
106,024
48
1,648
50
1
High Tech Computer Corp. (Suzhou)
19,273
12
41,163
19
1,379
42
1
HTC Europe Co., Ltd.
84,055
55
6,445
3
373
11
-
Others
36
-
200
-
924
28
-
$
130,990
85
$
171,901
78
$
13,869
$
423
7